Australian Dollar Price Forecast: Stuck in a range while traders wait for next catalyst
- AUD/USD left behind the recent weakness and refocused on 0.6500 and above.
- The US Dollar succumbed to the renewed selling pressure after poor US data.
- Australian GDP figures came in stronger than initial forecasts in the second quarter.

The Australian Dollar (AUD) clawed back ground against the US Dollar (USD) on Wednesday, with AUD/USD reclaiming levels above the 0.6500 mark after Tuesday’s sharp pullback.
The rebound came as the Greenback slipped, pressured by fresh signs of cooling in the US labour market through July.
Australia’s inflation still running hot
Price pressures remain sticky Down Under: July’s Monthly CPI Indicator (Weighted Mean) rose to 2.8% from 1.9% in June, while Q2 CPI climbed 0.7% on the quarter and 2.1% over the year. The data keeps inflation concerns alive and justifies the Reserve Bank of Australia’s (RBA) cautious approach.
Resilient data backdrop
Australia’s broader economic picture looks solid: August’s final Manufacturing PMI came in at 53.0, while services reached 55.8. Retail sales jumped 1.2% in June, and the trade surplus widened to A$5.365B. Labour market strength was also evident, with unemployment edging down to 4.2% as employment rose by 24.5K.
Private Capital Expenditure added 0.2% in Q2, reflecting steady investment, while GDP surprised to the upside with 0.6% quarterly growth and 1.8% annualised during the April-June period.

RBA stresses data dependence
The RBA trimmed rates by 25 bps earlier this month to 3.60% and cut its 2025 growth outlook. Governor Michele Bullock pushed back against calls for deeper cuts, emphasising that the policy remains "data-dependent."
The latest minutes suggest that faster easing could be on the table if the labour market weakens, but a slower pace is likely if conditions remain tight.
Meanwhile, markets see the RBA keeping its Official Cash Rate (OCR) unchanged at its September 30 meeting, while implied rates expect around 26 basis points of easing by year-end.
China’s uneven recovery matters
China’s outlook continues to influence the Aussie. Q2 GDP rose 5.2% YoY, with industrial output up 7%, but retail sales lagged. August PMIs showed manufacturing slipping to 49.4 while services ticked up to 50.3. The trade surplus narrowed, and inflation was flat.
The People’s Bank of China (PBoC) left its One-Year and Five-Year Loan Prime Rates (LPR) unchanged last month, as expected.
Speculators add to Aussie shorts
Commodity Futures Trading Commission (CFTC) data showed net speculative shorts in AUD climbing back toward April 2024 levels, at around 100.6K contracts in the week to August 26. Open interest also rose for a fourth straight week, now close to 191.2K contracts.
AUD/USD technical outlook: Rangebound
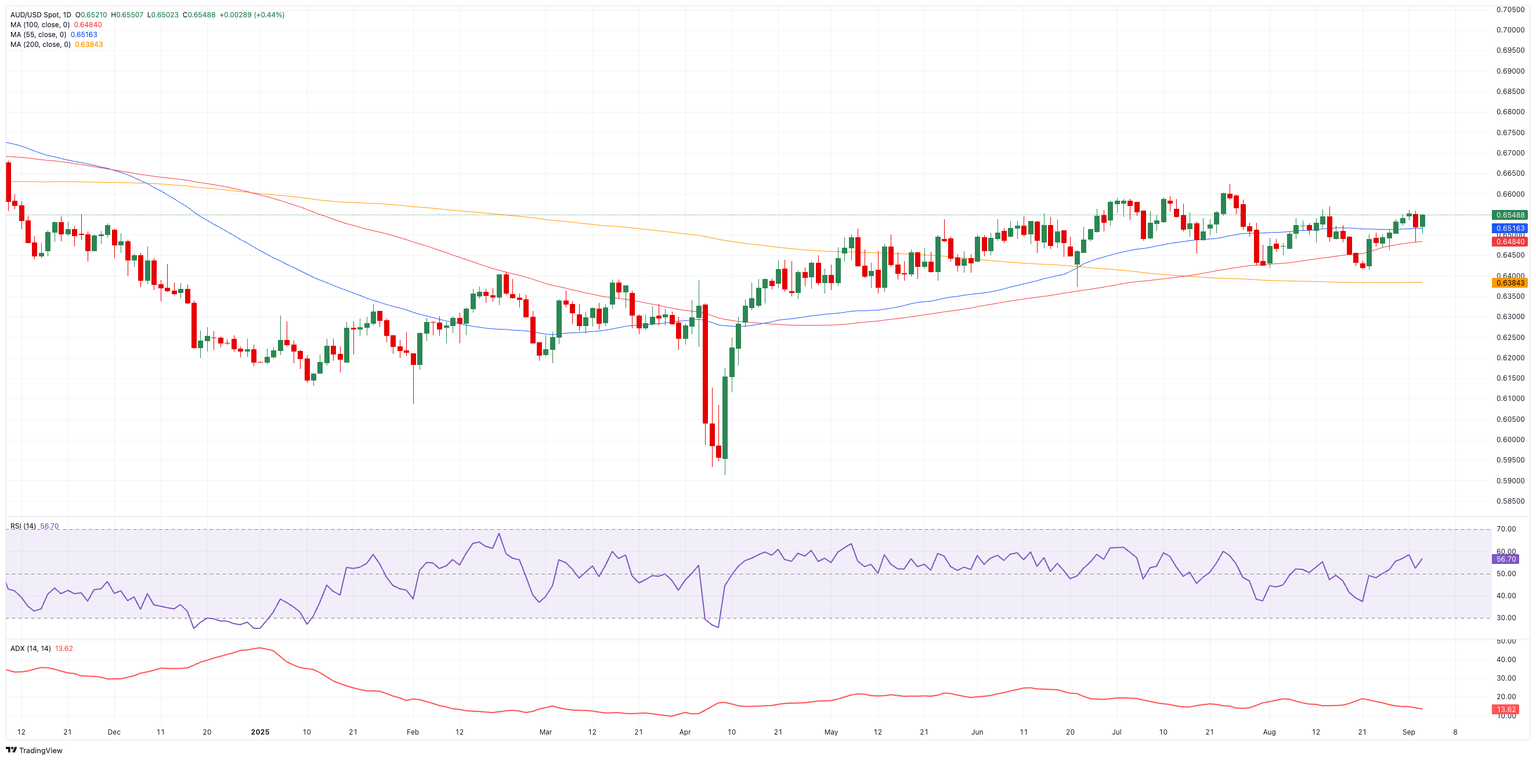
For now, AUD/USD remains trapped between 0.6400 and 0.6600. Resistance sits at the weekly high of 0.6568 (August 14), ahead of the 2025 ceiling at 0.6625 (July 24). A break higher could target the November 2024 peak at 0.6687 (November 7), with 0.7000 looming further out.
On the downside, support comes at 0.6414 (August 21). A move lower would bring the 200-day SMA at 0.6385 into view, just above the June floor at 0.6372 (June 23).
Momentum signals remain mixed: the Relative Strength Index (RSI) rising back toward 57 suggests swelling buying conviction, while the Average Directional Index (ADX) around 13 points to a still weak trend.
AUD/USD daily chart
Outlook: Waiting for the next catalyst
Absent a clear trigger, whether stronger Chinese data, a shift from the Fed, or an RBA surprise, AUD/USD looks set to drift sideways, locked in its current consolidation phase.
GDP FAQs
A country’s Gross Domestic Product (GDP) measures the rate of growth of its economy over a given period of time, usually a quarter. The most reliable figures are those that compare GDP to the previous quarter e.g Q2 of 2023 vs Q1 of 2023, or to the same period in the previous year, e.g Q2 of 2023 vs Q2 of 2022. Annualized quarterly GDP figures extrapolate the growth rate of the quarter as if it were constant for the rest of the year. These can be misleading, however, if temporary shocks impact growth in one quarter but are unlikely to last all year – such as happened in the first quarter of 2020 at the outbreak of the covid pandemic, when growth plummeted.
A higher GDP result is generally positive for a nation’s currency as it reflects a growing economy, which is more likely to produce goods and services that can be exported, as well as attracting higher foreign investment. By the same token, when GDP falls it is usually negative for the currency. When an economy grows people tend to spend more, which leads to inflation. The country’s central bank then has to put up interest rates to combat the inflation with the side effect of attracting more capital inflows from global investors, thus helping the local currency appreciate.
When an economy grows and GDP is rising, people tend to spend more which leads to inflation. The country’s central bank then has to put up interest rates to combat the inflation. Higher interest rates are negative for Gold because they increase the opportunity-cost of holding Gold versus placing the money in a cash deposit account. Therefore, a higher GDP growth rate is usually a bearish factor for Gold price.
Premium
You have reached your limit of 3 free articles for this month.
Start your subscription and get access to all our original articles.
Author

Pablo Piovano
FXStreet
Born and bred in Argentina, Pablo has been carrying on with his passion for FX markets and trading since his first college years.


