|

AUD/USD tops moving averages but indicators move sideways

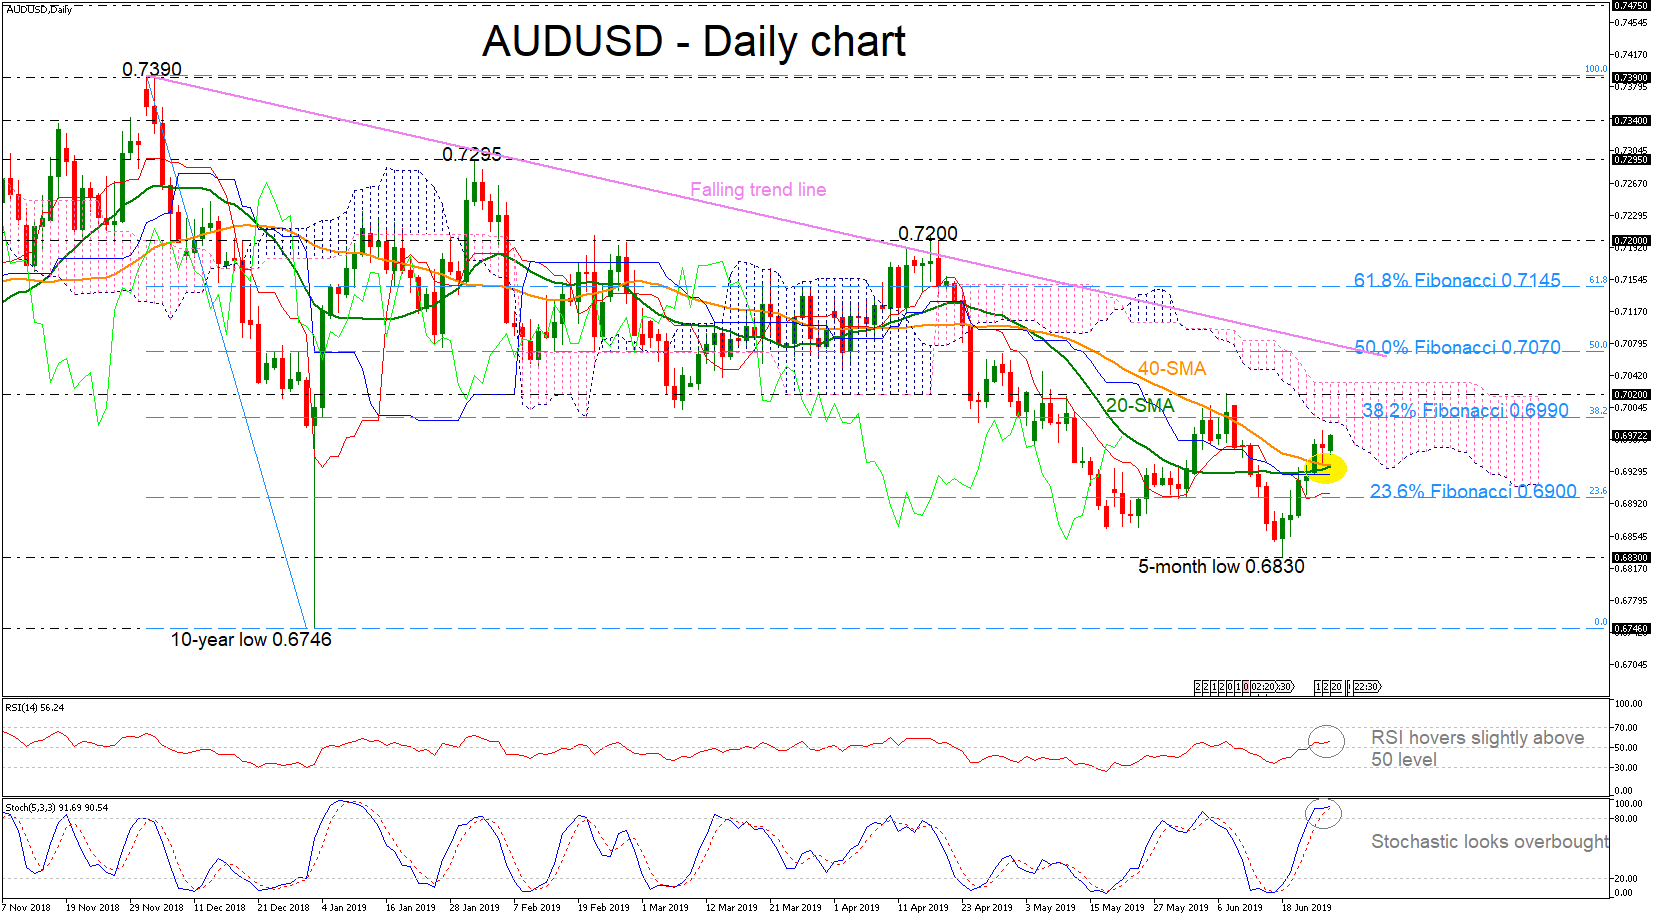
AUDUSD has been extending its gains since the previous week following the strong support on the five-month low near 0.6830. The pair surpassed above the 20- and 40-day simple moving averages (SMAs) which are ready to post a bullish crossover, signaling further upside momentum.

However, the stochastic oscillator seems to be losing momentum in the overbought territory, the RSI is still flattening slightly above the 50 level as well as the red Tenkan-sen and the blue Kijun-sen lines, all signaling a more cautious trading in the short term.

The pair needs to overcome the 38.2% Fibonacci retracement level of the downfall from 0.7390 to 0.6830 near 0.6990 to meet a key barrier around the 0.7020 resistance, taken from the latest high on June 7, near the upper surface of the Ichimoku cloud. The 50.0% Fibonacci mark of 0.7070 could act as resistance too as it overlaps with the falling trend line before a more important battle starts near the 61.8% Fibo of 0.7145.

On the flipside, if the price weakens below the SMAs, support to downside movements could be initially detected around the 23.6% Fibo of 0.6900. Clearing this zone, the next stop could be at the five-month low of 0.6830.

In the short-term picture, the sentiment turned slightly bullish after the price surpassed the 0.6900 number but the technical indicators are moving sideways expressing a possible downside trend again. Traders should wait for a jump above the six-month descending trend line before initiating positive positions.

AUDUSD

Author

Melina Deltas, CFTe

Melina joined XM in December 2017 as an Investment Analyst in the Research department. She can clearly communicate market action, particularly technical and chart pattern setups.

More from Melina Deltas, CFTe
Share:

Editor's Picks

EUR/USD: US Dollar to remain pressured until uncertainty fog dissipates

Unimpressive European Central Bank left monetary policy unchanged for the fifth consecutive meeting. The United States first-tier employment and inflation data is scheduled for the second week of February. EUR/USD battles to remain afloat above 1.1800, sellers moving to the sidelines.

GBP/USD reclaims 1.3600 and above

GBP/USD reverses two straight days of losses, surpassing the key 1.3600 yardstick on Friday. Cable’s rebound comes as the Greenback slips away from two-week highs in response to some profit-taking mood and speculation of Fed rate cuts. In addition, hawkish comments from the BoE’s Pill are also collaborating with the quid’s improvement.

Gold: Volatility persists in commodity space

After losing more than 8% to end the previous week, Gold remained under heavy selling pressure on Monday and dropped toward $4,400. Although XAU/USD staged a decisive rebound afterward, it failed to stabilize above $5,000. The US economic calendar will feature Nonfarm Payrolls and Consumer Price Index data for January, which could influence the market pricing of the Federal Reserve’s policy outlook and impact Gold’s performance.

Week ahead: US NFP and CPI data to shake Fed cut bets, Japan election looms

US NFP and CPI data awaited after Warsh’s nomination as Fed chief. Yen traders lock gaze on Sunday’s snap election. UK and Eurozone Q4 GDP data also on the agenda. China CPI and PPI could reveal more weakness in domestic demand.

Three scenarios for Japanese Yen ahead of snap election

The latest polls point to a dominant win for the ruling bloc at the upcoming Japanese snap election. The larger Sanae Takaichi’s mandate, the more investors fear faster implementation of tax cuts and spending plans. 

XRP rally extends as modest ETF inflows support recovery

Ripple is accelerating its recovery, trading above $1.36 at the time of writing on Friday, as investors adjust their positions following a turbulent week in the broader crypto market. The remittance token is up over 21% from its intraday low of $1.12.