|

AUDUSD Technical Analysis March 21/2017

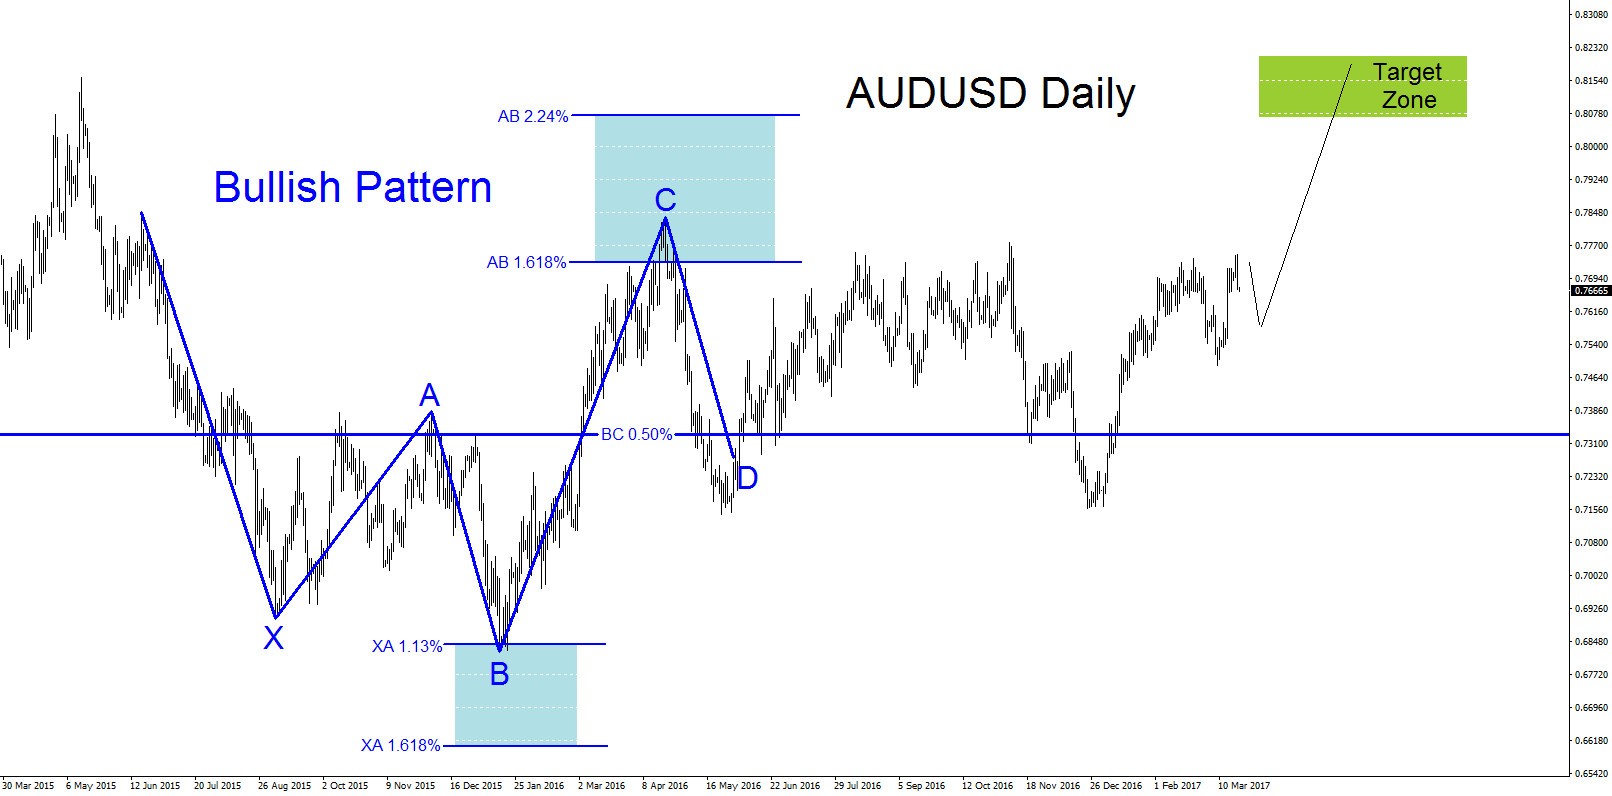
AUDUSD found a possible bottom in December 2015 and has bounced higher. The pair has tried to test the December 2015 low but has been rejected twice, once in May 2016 and the second time in December 2016, both at the point D (Blue pattern) BC 0.50%-0.618% Fib. retracement levels. We at Elliottwave-Forecast still feel the pair can continue pushing higher in the coming days and weeks. Only time will tell what the pair will do. Below are scenarios of why we feel the pair remains bullish.

AUDUSD Daily Chart: Bullish pattern (Blue) still needs to push above point C high to complete the pattern. If AUDUSD continues higher we can expect the pair to push towards the green target zone box (0.8070 – 0.8200 area) which is also the Fib. 1.0% – 1.236% extension.

AUDUSD

AUDUSD 1 Hour Chart: On the 1 hour chart we can see another bullish pattern (Blue) that triggers a BUY at the BC 0.50% Fib. retracement level where point D of the bullish pattern can terminate. Expect bulls to be waiting at the green box (Buy Zone) to push the pair higher. The buy zone is also at a support/resistance level where price can bounce off.

AUDUSD

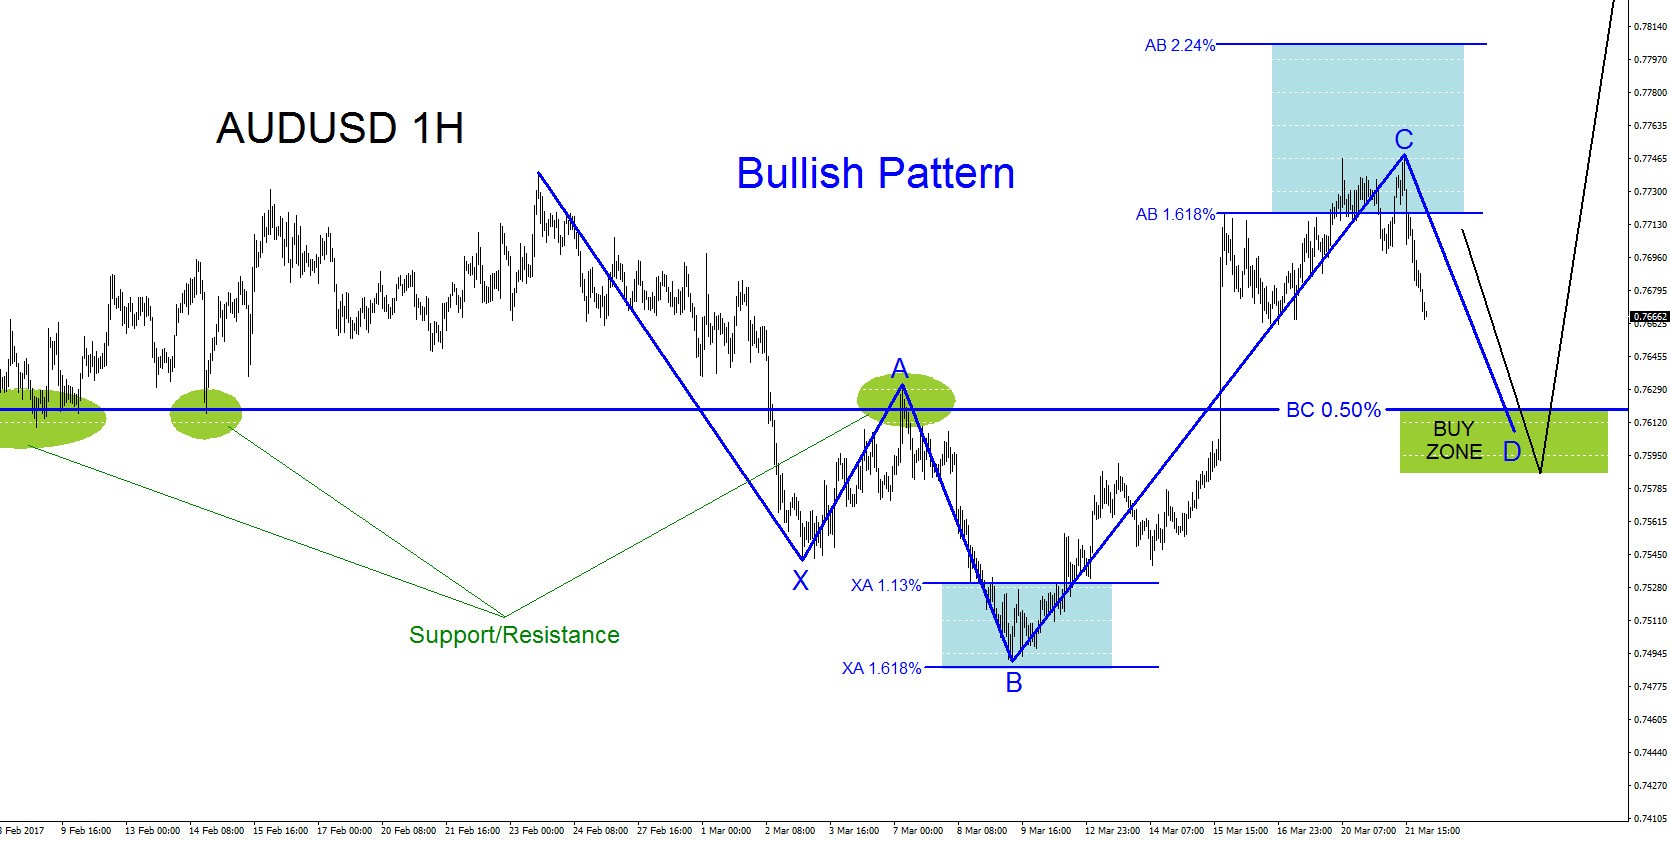
If looking to buy AUDUSD traders should be patient and wait for the 1 hour blue point D pullback to the BC 0.50% Fib. level buy zone (green box). Waiting for the blue point D pullback/retrace to the possible buy zone area will offer a better risk/reward trade setup. Stop loss should be placed at the blue point B 0.7490 low.


Become a Successful Trader and Master Elliott Wave like a Pro. Start your Free 14 Day Trial at - Elliott Wave Forecast.

Author

Elliott Wave Forecast Team

Elliott Wave Forecast Team

ElliottWave-Forecast.com

More from Elliott Wave Forecast Team
Share:

Editor's Picks

EUR/USD hits two-day highs near 1.1820

EUR/USD picks up pace and reaches two-day tops around 1.1820 at the end of the week. The pair’s move higher comes on the back of renewed weakness in the US Dollar amid growing talk that the Fed could deliver an interest rate cut as early as March. On the docket, the flash US Consumer Sentiment improves to 57.3 in February.

GBP/USD reclaims 1.3600 and above

GBP/USD reverses two straight days of losses, surpassing the key 1.3600 yardstick on Friday. Cable’s rebound comes as the Greenback slips away from two-week highs in response to some profit-taking mood and speculation of Fed rate cuts. In addition, hawkish comments from the BoE’s Pill are also collaborating with the quid’s improvement.

Gold climbs further, focus is back to 45,000

Gold regains upside traction and surpasses the $4,900 mark per troy ounce at the end of the week, shifting its attention to the critical $5,000 region. The move reflects a shift in risk sentiment, driving flows back towards traditional safe haven assets and supporting the yellow metal.

Crypto Today: Bitcoin, Ethereum, XRP rebound amid risk-off, $2.6 billion liquidation wave

Bitcoin edges up above $65,000 at the time of writing on Friday, as dust from the recent macro-triggered sell-off settles. The leading altcoin, Ethereum, hovers above $1,900, but resistance at $2,000 caps the upside. Meanwhile, Ripple has recorded the largest intraday jump among the three assets, up over 10% to $1.35.

Three scenarios for Japanese Yen ahead of snap election

The latest polls point to a dominant win for the ruling bloc at the upcoming Japanese snap election. The larger Sanae Takaichi’s mandate, the more investors fear faster implementation of tax cuts and spending plans. 

XRP rally extends as modest ETF inflows support recovery

Ripple is accelerating its recovery, trading above $1.36 at the time of writing on Friday, as investors adjust their positions following a turbulent week in the broader crypto market. The remittance token is up over 21% from its intraday low of $1.12.