AUD/USD Price Forecast: Bullish outlook likely above the 200-day SMA
- AUD/USD came under extra downside pressure, revisiting the 0.6440 region.
- The US Dollar managed to reverse part of its recent leg lower.
- The RBA’s Monthly CPI Indicator will be the next salient data release in Oz.

The Australian Dollar added to the bearish start to the week on Tuesday, prompting AUD/USD to face renewed and marked selling pressure and to slip back to the 0.6440-0.6430 band, putting its critical 200-day simple moving average (SMA) to the test at the same time.
The pair’s daily pullback came in response to the marked rebound in the US Dollar (USD), as investors continued to adjust to President Trump’s decision to postpone the application of tariffs on European Union (EU) exports.
Monetary policy divergence shapes AUD/USD story
In the meantime, the developing difference between the Federal Reserve (Fed) and the Reserve Bank of Australia (RBA) has emerged as another factor to define the price action in spot.
On that, Chair Jerome Powell kept a cautious, data-dependent tone even when the Fed decided to keep rates the same at its May meeting. Softer inflation numbers for April and a rise in risk appetite have thus driven markets to forecast a possible rate drop by September.
On May 20, the RBA made a 25 basis-point decrease that resulted in an official cash rate of 3.85%. Forecasting the OCR to drop to 3.2% by 2027, the accompanying Monetary Policy Report (MPR) of the central bank suggested much more easing ahead. Though they admitted that policy settings had become "somewhat less restrictive", policymakers underlined residual uncertainties concerning local demand and global supply chains.
With inflation likely to bottom out close to 2.6%, the RBA also reduced its inflation projection and cut its 2025 GDP growth expectation to 2.1%.
China's support disappearing under structural headwinds
Recent figures from China were a mixed bag for Australian money. Although industrial output exceeded estimates, lacklustre fixed asset investment and declining retail sales point to a slowing down in the January-March period. Still, the overall growth path is on target for a 5% increase in Q2.
Still, structural difficulties abound. The housing market in China is still erratic, and US trade policy remains unknown and influences everything. Reflecting a dovish posture, the People's Bank of China on May 20 decreased both the 1-year and 5-year Loan Prime Rates by 10 basis points to 3.00% and 3.50%, respectively.
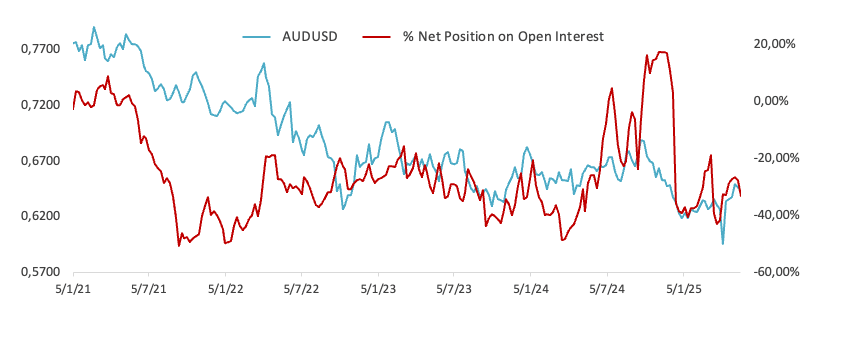
Bearish mood in speculative posture
Released on May 20, CFTC statistics showed a comeback in Australian Dollar negative attitude. Net short holdings peaked at slightly over 59K contracts, the highest level in the last four weeks. Though a drop in open interest might point to a somewhat less gloomy view, speculative posture remains wary.
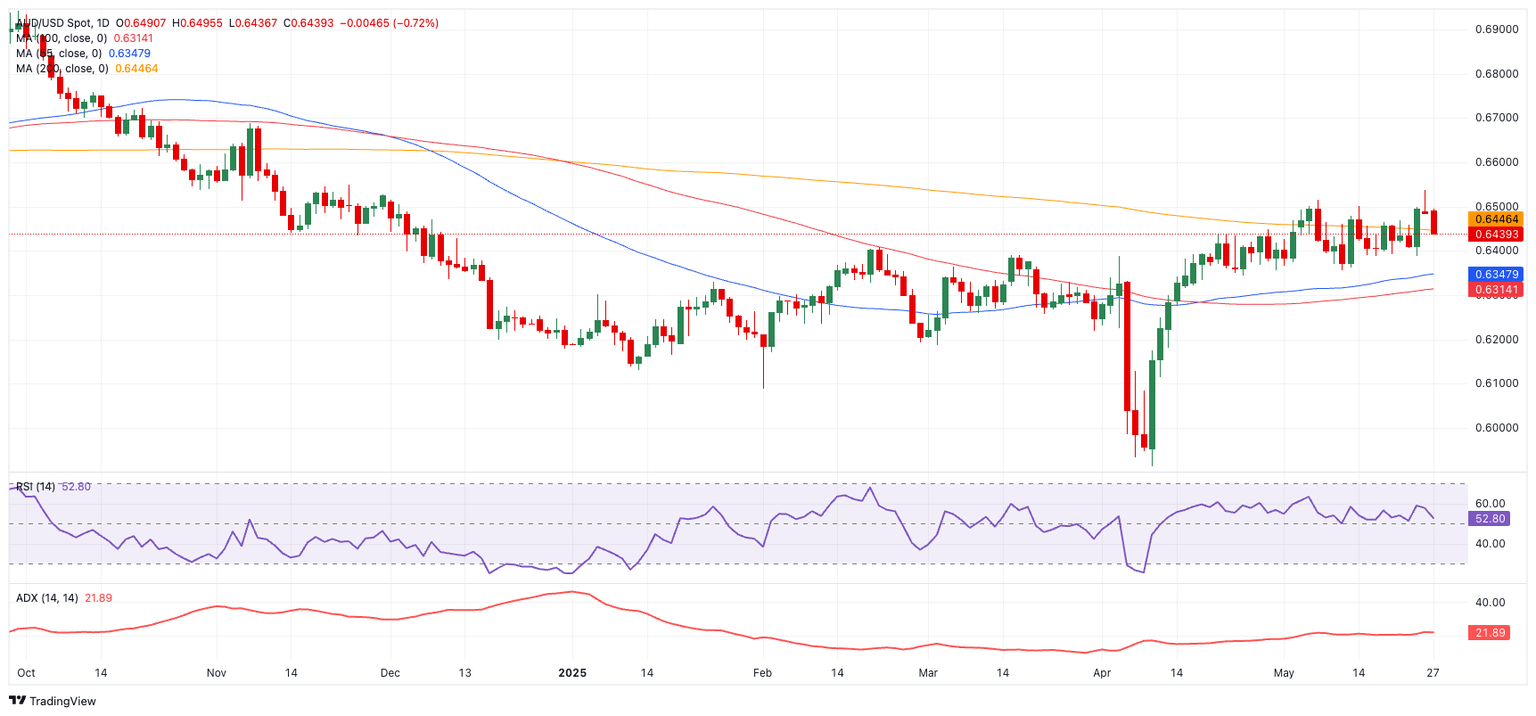
Technical outlook: Momentum builds, but direction not clear
A clear push over the 200-day SMA at 0.6450 will determine if AUD/USD can maintain a bullish breakout.
The 2025 high at 0.6537 (May 26), followed by the November 2024 high at 0.6687 (November 7) and the 2024 peak at 0.6942 (September 30), are the next important resistance levels.
On the downside, first support falls at the May low of 0.6356 (May 12), with further cushions at the transitory 55-day and 100-day SMAs at 0.6346 and 0.6312, respectively. A more thorough correction may see the pair slip towards the 2025 bottom at 0.5913 (April 9), maybe revisiting the epidemic low of 0.5506 (March 19, 2020).
Momentum indicators show a minor upward tilt; the Relative Strength Index (RSI) is close to 53 and the Average Directional Index (ADX) is over 23, indicating a continuing but not decisive advance.
AUD/USD daily chart
Premium
You have reached your limit of 3 free articles for this month.
Start your subscription and get access to all our original articles.
Author

Pablo Piovano
FXStreet
Born and bred in Argentina, Pablo has been carrying on with his passion for FX markets and trading since his first college years.


