AUD/USD Price Forecast: A test of the 200-day SMA should not be discarded
- AUD/USD extended its decline to three-week lows near 0.6760.
- The US Dollar alternated gains with losses near recent tops.
- Australia’s Inflation Gauge rose by 0.1% in September.

AUD/USD kicked off the new trading week on the back foot, intensifying its selling momentum and revisiting the 0.6760 region to hit new three-week lows.
The Australian Dollar's continuation of its downward trend mirrored that of other risk-sensitive currencies despite an irresolute day in the US Dollar (USD), as market participants continued to digest Friday’s stronger-than-expected US NFP (+254K), while unabated geopolitical tensions in the Middle East also underpinned the demand for the Greenback.
Adding to the negative sentiment around AUD, copper prices continued their recent decline, while iron ore prices added to Friday’s recovery despite persistent scepticism surrounding China's recently announced stimulus measures, particularly those targeting the housing sector, which, in turn, are expected to support iron ore prices.
On the monetary front, the Reserve Bank of Australia (RBA) kept its cash rate unchanged at 4.10% at its September gathering. While the RBA acknowledged inflation risks, Governor Michele Bullock indicated that a rate hike was not seriously considered.
Markets are currently pricing in a 55% probability of a 25-basis-point rate cut by the end of the year. Indeed, the RBA is expected to be among the last of the G10 central banks to lower rates, potentially cutting later this year to address sluggish economic activity and easing inflation pressures.
Even though Federal Reserve (Fed) rate cuts are already factored in, AUD/USD could see additional gains in 2024. However, uncertainties persist regarding China's economic outlook and the implementation of its stimulus efforts.
Domestically, the Inflation Gauge rose by 0.1% MoM in September, according to the Melbourne Institute.
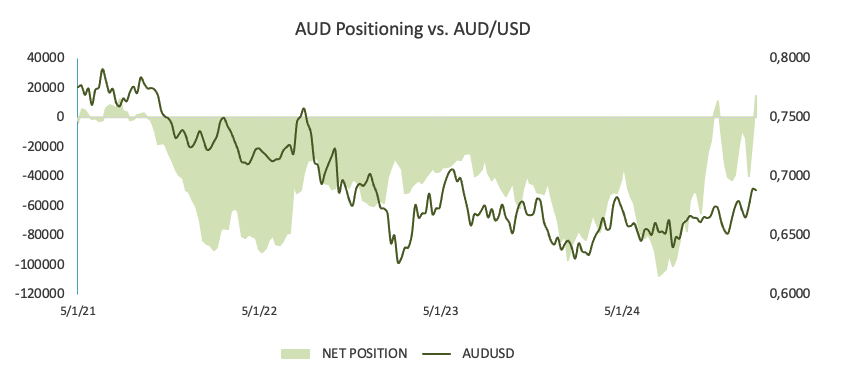
From the latest CFTC report, speculators held net longs for the first time since July in the week ending October 1. Furthermore, the move came in tandem with a decent increase in open interest. During that period, AUD/USD extended further its recovery, reclaiming the area beyond 0.6900 the figure for the first time since February 2023.
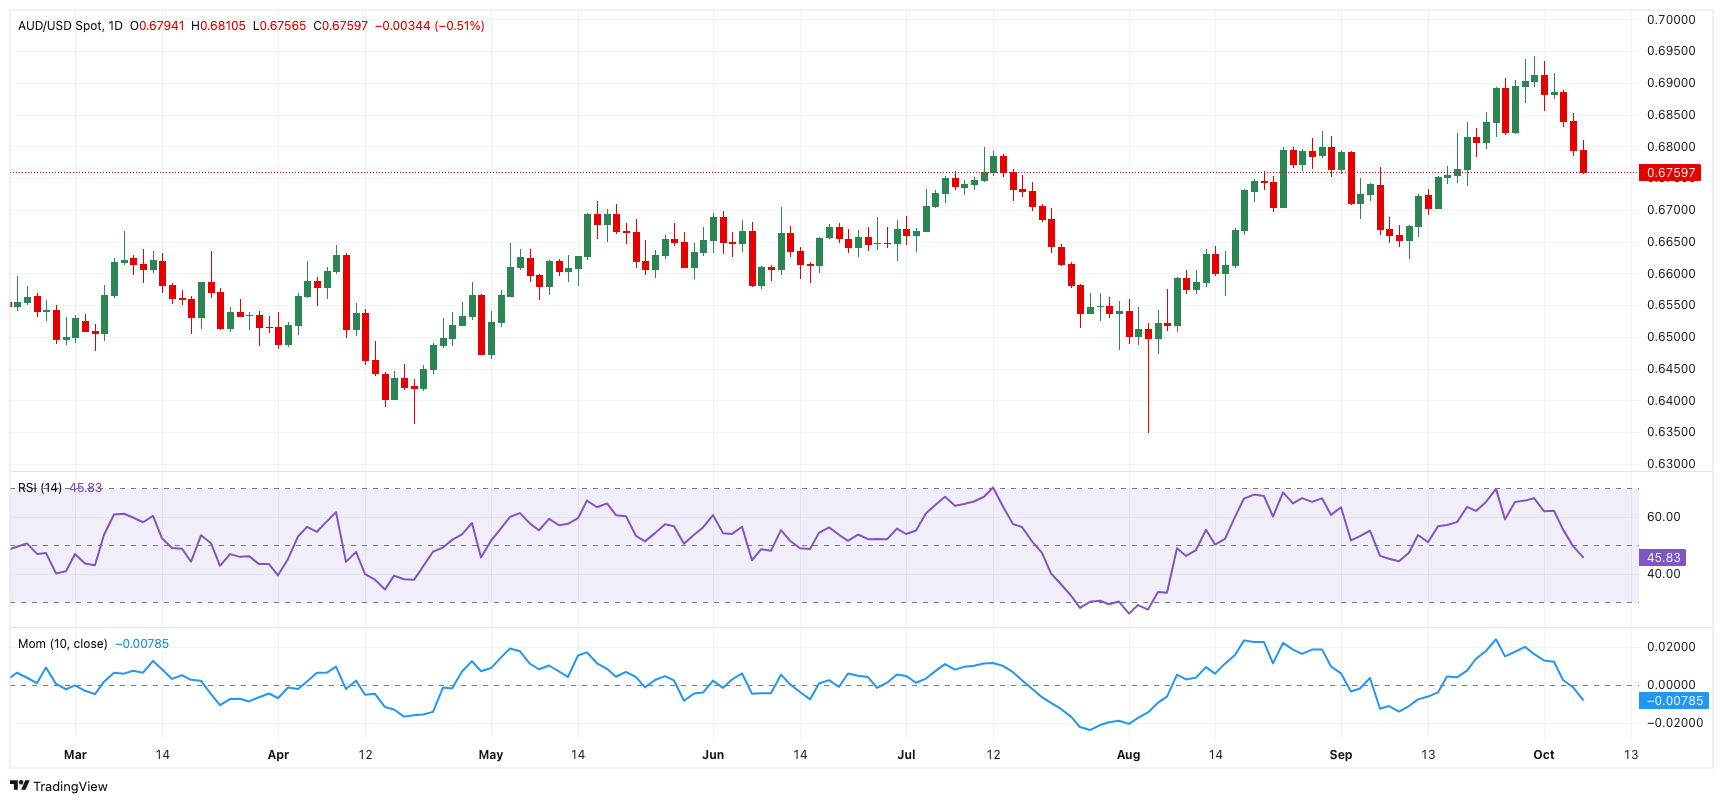
AUD/USD daily chart
 AUD/USD short-term technical outlook
Extra losses might cause AUD/USD to fall to retest the intermediate 55-day and 100-day SMAs of 0.6702 and 0.6687, respectively, ahead of the September low of 0.6622 (September 11), which is still bolstered by the key 200-day SMA (0.6626).
On the plus side, the initial obstacle occurs at the 2024 top of 0.6942 (September 30), before the critical 0.7000 threshold.
The four-hour chart indicates an acceleration of the negative trend. Having said that, the initial support is 0.6756, followed by 0.6737 and finally 0.6622. On the upside, the initial hurdle is the 100-SMA at 0.6829, ahead of the 55-SMA of 0.6869 and then 0.6942. The RSI tumbled to nearly 26.
Premium
You have reached your limit of 3 free articles for this month.
Start your subscription and get access to all our original articles.
Author

Pablo Piovano
FXStreet
Born and bred in Argentina, Pablo has been carrying on with his passion for FX markets and trading since his first college years.


