|

AUD/USD has one more substantial support line after Lowe sent it lower – Confluence Detector

Reserve Bank of Australian Governor Phillip Lowe said that he is considering a rate cut in the upcoming June meeting. His words sent the Aussie significantly lower. What are the levels to watch in AUD/USD?

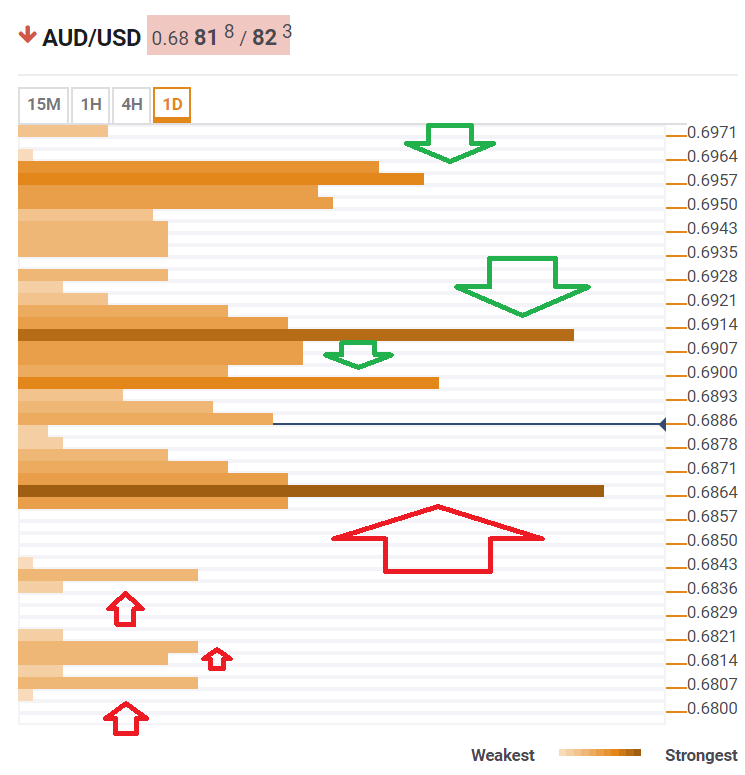
The Technical Confluences Indicator shows that AUD/USD has significant support at 0.6864 which is the convergence of the previous weekly low, the Pivot Point one-month Support 2, the Bollinger Band 4h-Lower, and more lines.

If the Aussie dollar loses this substantial support line, it enjoys only single support lines such as the Pivot Point one-day S2 at 0.6940, the PP 1-week S1 at 0.6817, and the PP 1d-S3 at 0.6807.

Resistance is much more significant. AUD/USD has an initial hurdle at 0.6897 which is the confluence of the Fibonacci 38.2% one-day, the Fibonacci 23.6% one-week, and the Simple Moving Average 5-15m. 

The next cap is more considerable. At 0.6910, the A$ faces a dense cluster of lines: the SMA 5-1d, the SMA 100-1h, the Fibonacci 61.8% one-day, the SMA 50-15m, the SMA10-1h, the SMA 10-1h, and more. 

Further above, if it stages a massive recovery, AUD/USD may target 0.6957 where the PP 1m-S1, the PP 1w-R1, the SMA 10-1d, and the Fibonacci 61.8% one-week converge. 

Here is how it looks on the tool:

AUD USD May 21 2019 technical confluence levels

Confluence Detector

The Confluence Detector finds exciting opportunities using Technical Confluences. The TC is a tool to locate and point out those price levels where there is a congestion of indicators, moving averages, Fibonacci levels, Pivot Points, etc. Knowing where these congestion points are located is very useful for the trader, and can be used as a basis for different strategies.

This tool assigns a certain amount of “weight” to each indicator, and this “weight” can influence adjacents price levels. These weightings mean that one price level without any indicator or moving average but under the influence of two “strongly weighted” levels accumulate more resistance than their neighbors. In these cases, the tool signals resistance in apparently empty areas.

Learn more about Technical Confluence

Author

Yohay Elam

Yohay Elam

FXStreet

Yohay is in Forex since 2008 when he founded Forex Crunch, a blog crafted in his free time that turned into a fully-fledged currency website later sold to Finixio.

More from Yohay Elam
Share:

Editor's Picks

EUR/USD: Cautiously optimistic near 1.1550 ahead of the ECB

EUR/USD extends its weekly recovery for the third day in a row on Wednesday, navigating in a sidelined fashion around 1.1550 on the back of humble losses in the US Dollar. In the meantime, market participants continue to closely follow developments in the Middle East while slowly gearing up for the ECB gathering on Thursday.

GBP/USD recedes from tops, hovers around 1.3400

GBP/USD could not sustain the initial bull run and is now slipping back toward the 1.3400 neighbourhood on Wednesday. Cable’s continuation of the ongoing leg higher follows mild selling pressure on the Greenback, despite steady uncertainty on the geopolitical front and elevated US inflation.

Gold bleeding continues as Middle East crisis escalates, Fed hike coming

Gold is accelerating its downward trends and approaches the area of $4,100 per troy ounce on Wednesday, where the 2026 bottom sits so far. The persistent decline in the precious metal almost exclusively follows the swelling opinion that the Fed will keep a cautious stance in H2, a view that was reinforced following earlier US CPI data.

$1,500: Why Ethereum just crashed 20% despite spot markets barely selling
Ethereum (ETH) recently suffered one of its sharpest declines of 2026, dropping more than 20% and briefly testing the $1,500 area. While the sell-off appeared to reflect broader market fears, derivatives and on-chain data suggest a more complex story may be unfolding beneath the surface.
Brutal sell-off: Silver deepens months-long slide, refocusing on $60

Silver has never been known for its calm temperament. The precious metal can spend weeks grinding higher before suddenly giving back months of gains in a matter of days. That volatile reputation has been on full display in recent weeks.

The US economy defies the rules: 100 days into the Oil shock and the recession signal is still missing

More than three months after the start of the Iran war and the resulting disruption to global energy markets, the US economy continues to display remarkable resilience. The conflict has triggered a sharp rise in Oil prices, reignited inflationary pressures and fueled widespread concerns about a potential economic slowdown.