AUD/USD Forecast: No respite to the downside bias
- AUD/USD broke below 0.6500 to print new two-month lows.
- Australian inflation came in mixed; Retail Sales surprised to the upside.
- The RBA will most likely keep its policy rate unchanged next week.

AUD/USD added to Tuesday’s losses and breached the key 0.6500 support for the first time since early May, extending the recent breakdown of the critical 200-day SMA (0.6589).
The ongoing monthly reversal is mostly driven by poor economic prospects from China, falling commodity prices, the intermittent strength of the US Dollar (USD), and a recent interest rate cut by the People’s Bank of China (PBoC).
On the latter, the PBoC recently cut its rate, weakening the Chinese yuan and negatively impacting the Australian dollar due to Australia's economic ties with China and the AUD's role as a liquid proxy for the yuan.
Additionally, persistent weakness in iron ore prices has contributed to the AUD's decline, while a small recovery in copper prices did nothing to soothe the intense sell-off in the Australian currency.
Regarding monetary policy, recently published inflation figures in Australia played against potential further tightening by the Reserve Bank of Australia (RBA), as was insofar projected by market participants. Against that, odds for the central bank to maintain the official cash rate at 4.35% at its meeting next week rose in the past few hours in response to the inflation results, while the broader scenario sees the bank keeping its rates unchanged for the remainder of the year.
Overall, the RBA is expected to be the last G10 central bank to begin cutting interest rates. The central bank is not in a hurry to ease policy, anticipating that it will take time for inflation to consistently fall within the 2-3% target range.
Potential easing by the Federal Reserve (Fed) in the medium term, contrasted with the RBA's likely prolonged restrictive stance, could support AUD/USD in the coming months.
However, slow momentum in the Chinese economy might hinder a sustained recovery of the Australian dollar as China continues to face post-pandemic challenges, deflation, and insufficient stimulus for a convincing recovery. Concerns about demand from China, the world's second-largest economy, also had an impact following the country's Politburo meeting, where, despite pledges to support the economy, no specific new stimulus measures were announced.
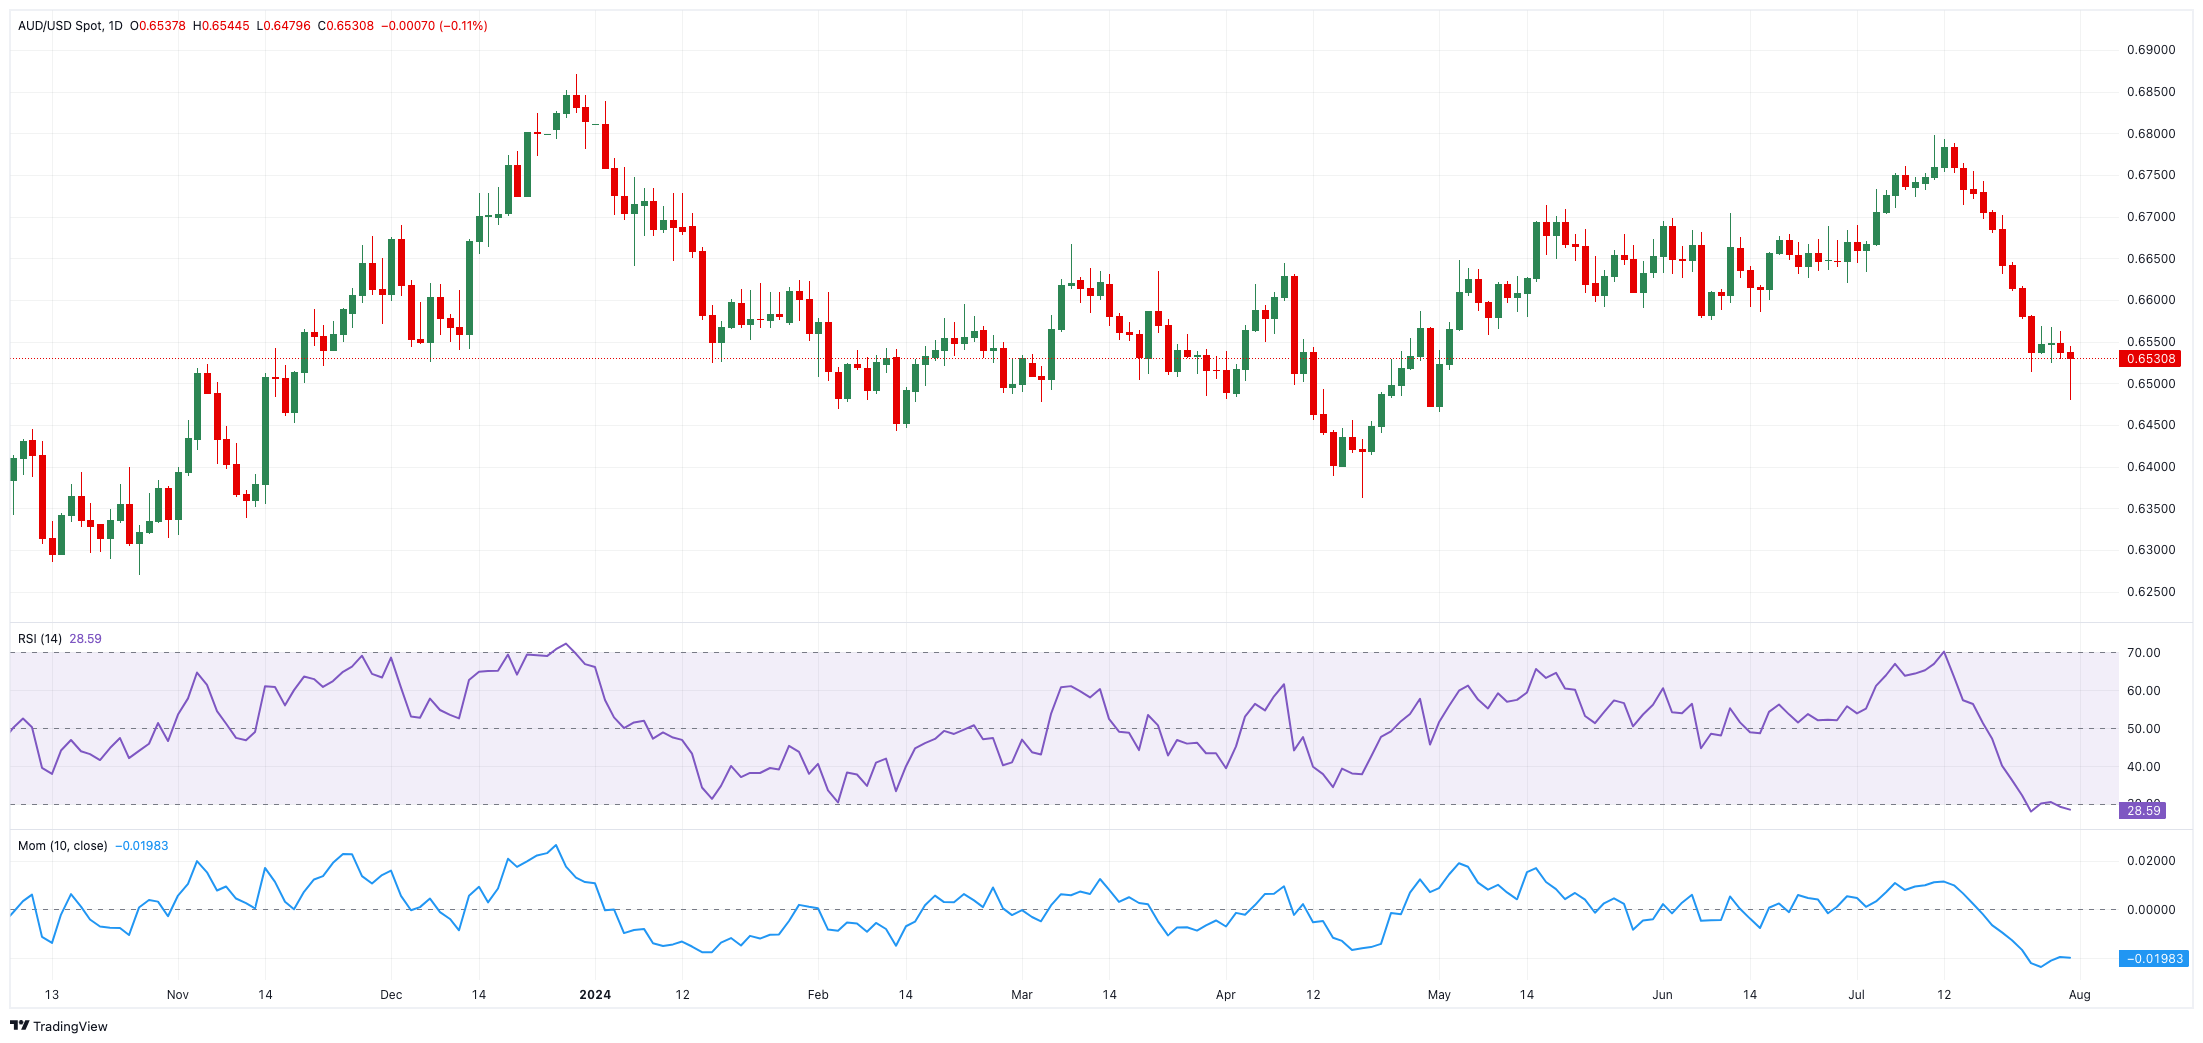
AUD/USD daily chart
AUD/USD short-term technical outlook
Further losses in the AUD/USD may find initial support at the July low of 0.6479 (July 31), ahead of the May low of 0.6465 and the 2024 bottom of 0.6362 (April 19).
Bullish efforts, on the other hand, may encounter early resistance at the crucial 200-day SMA of 0.6589, followed by the temporary 100-day and 55-day SMAs at 0.6603 and 0.6655, respectively, before the July peak of 0.6798 (July 8) and the December high of 0.6871.
Overall, more retracements in the AUD/USD are expected as the pair stays below the 200-day SMA.
The four-hour chart shows some acceleration of the downward bias. That said, immediate support is at 0.6479, prior to 0.6465. On the plus side, the initial barrier is at the 55-SMA of 0.6592 seconded by 0.6610 and the 200-SMA of 0.6665. The RSI bounced above 44.
Premium
You have reached your limit of 3 free articles for this month.
Start your subscription and get access to all our original articles.
Author

Pablo Piovano
FXStreet
Born and bred in Argentina, Pablo has been carrying on with his passion for FX markets and trading since his first college years.


