AUD/USD Forecast: Next on the downside comes the 2024 low
- AUD/USD resumed the downward bias and breached 0.6500.
- Extra pullbacks could shift the attention to the 2024 low near 0.6450.
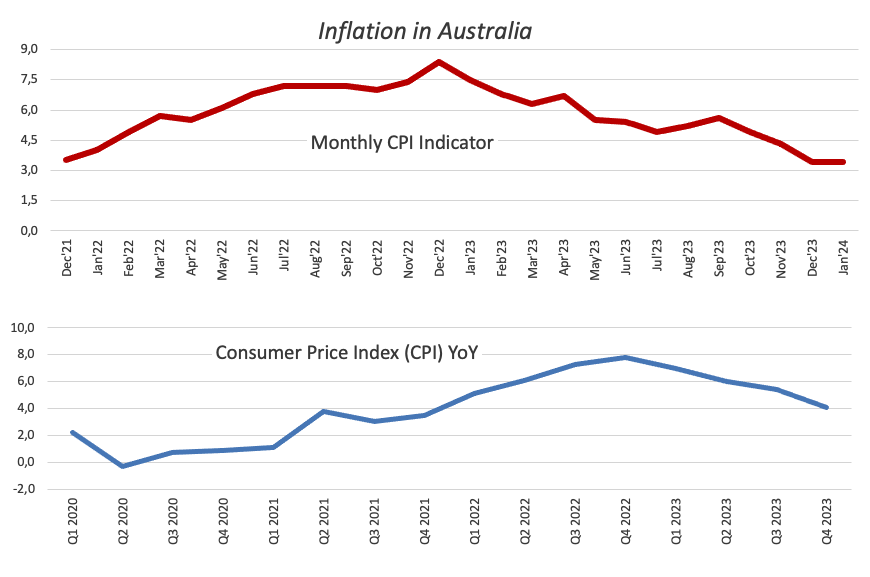
- Inflation in January remained sticky around 3.4%.

The Australian dollar resumed its downward path after a sluggish start to the week, retreating to the area of multi-day lows in the sub-0.6500 region on Wednesday.
This sharp downtick in AUD/USD occurred in response to a noticeable rebound in the Greenback, which lifted the USD Index (DXY) back above the 104.00 hurdle despite the move lower in US yields.
Contributing to the decline in spot remained the still unabated corrective move in iron ore prices, which extended their retracement to fresh multi-month lows near the $125.00 mark per tonne against the backdrop of equally persevering concerns around the Chinese housing market.
Spot price movements mirrored the subdued performance of the US Dollar, with investors weighing the likelihood of the Federal Reserve (Fed) implementing monetary easing around June or later. This sentiment was reinforced by recent comments from certain Fed officials as well as solid fundamentals.
While potential stimulus measures in China could temporarily support a rebound, sustained recovery news from the country is crucial for providing stronger backing to the Australian dollar and potentially triggering a more substantial uptrend in AUD/USD. A resurgence in the Chinese economy is also anticipated to coincide with an increase in commodity prices, which should be supportive of a stronger AUD.
Concerning the Reserve Bank of Australia (RBA), the cautious stance of the central bank is expected to mitigate significant downward pressure on the Australian dollar, as it is among the latest G10 central banks to begin the process of interest rate cuts.
Regarding the RBA, its Monthly CPI Indicator showed consumer prices rose by 3.4% in January, matching December’s uptick. In the wake of the release, the expectation for RBA easing saw minimal influence, despite market indicators suggesting an 80% probability of the first cut occurring in August, while the swap market continues to anticipate approximately 40 bps of total easing within the year.
AUD/USD daily chart

AUD/USD short-term technical outlook
In case sellers keep pushing harder, AUD/USD initially faces contention at its 2024 low of 0.6452 (February 13). Breaking below this level may result in a potential visit to the 2023 low of 0.6270 (October 26), followed by the round level of 0.6200 and the 2022 low of 0.6169 (October 13).
On the upside, after clearing the weekly high of 0.6595 (February 22), the pair may retest the temporary 55-day SMA at 0.6626, which coincides with the late-January tops (January 30). A break above this range may take spot to the December 2023 peak of 0.6871 (December 28), followed by the July 2023 high of 0.6894 (July 14) and the June 2023 top of 0.6899 (June 16), all before the key 0.7000 barrier.
It is worth mentioning that AUD/USD should see its downside bias mitigated once it clears the important 200-day SMA at 0.6559 on a convincing fashion.
The 4-hour chart indicates that further weakness now appears in the pipeline. The initial support emerges at 0.6442 ahead of 0.6347 and then 0.6338. On the other hand, the 200-SMA aligns at 0.6554 prior to 0.6595 and 0.6611. Furthermore, the MACD slipped below zero, while the RSI navigated around 32.
Premium
You have reached your limit of 3 free articles for this month.
Start your subscription and get access to all our original articles.
Author

Pablo Piovano
FXStreet
Born and bred in Argentina, Pablo has been carrying on with his passion for FX markets and trading since his first college years.


