AUD/USD Forecast: Extra advance now looks to the RBA
- AUD/USD extended its upside momentum beyond 0.6600.
- The firm tone in the commodity complex helped the pair’s upside.
- The RBA is largely expected to keep its OCR unchanged on Tuesday.

Monday’s irresolute price action in the US Dollar (USD) encouraged AUD/USD to trespass the key 0.6600 barrier and trade once again at shouting distance from recent peaks near 0.6650.
Simultaneously, the Greenback struggled to regain upside traction while market participants continued to adjust to the latest FOMC meeting, where the central bank opted to keep interest rates unchanged, and the weaker-than-estimated NFP in April.
Further strength reinforcing the Australian dollar’s bullish impetus came from the solid session in copper prices, which added to Friday’s gains, while iron ore prices remained in the area of recent peaks just below $120.00 per tonne.
Regarding monetary policy, investors will be closely monitoring the upcoming Reserve Bank of Australia (RBA) interest rate decision on Tuesday, especially after recent inflation figures surpassed forecasts. So far, market sentiment suggests a 90% likelihood of a 25 bps rate cut in 2024, compared to the approximately 50 bps of easing earlier this month.
Furthermore, both the RBA and the Federal Reserve are expected to commence their easing cycles later than many of their other G10 counterparts.
Considering the Fed's commitment to tightening monetary policies and the potential initiation of an easing cycle by the RBA later this year, sustained gains in the AUD/USD pair are currently perceived as limited.
Additionally, recent economic data from China has not provided clear indications of a robust recovery, which is crucial for supporting a significant resurgence in the Australian dollar.
AUD/USD daily chart
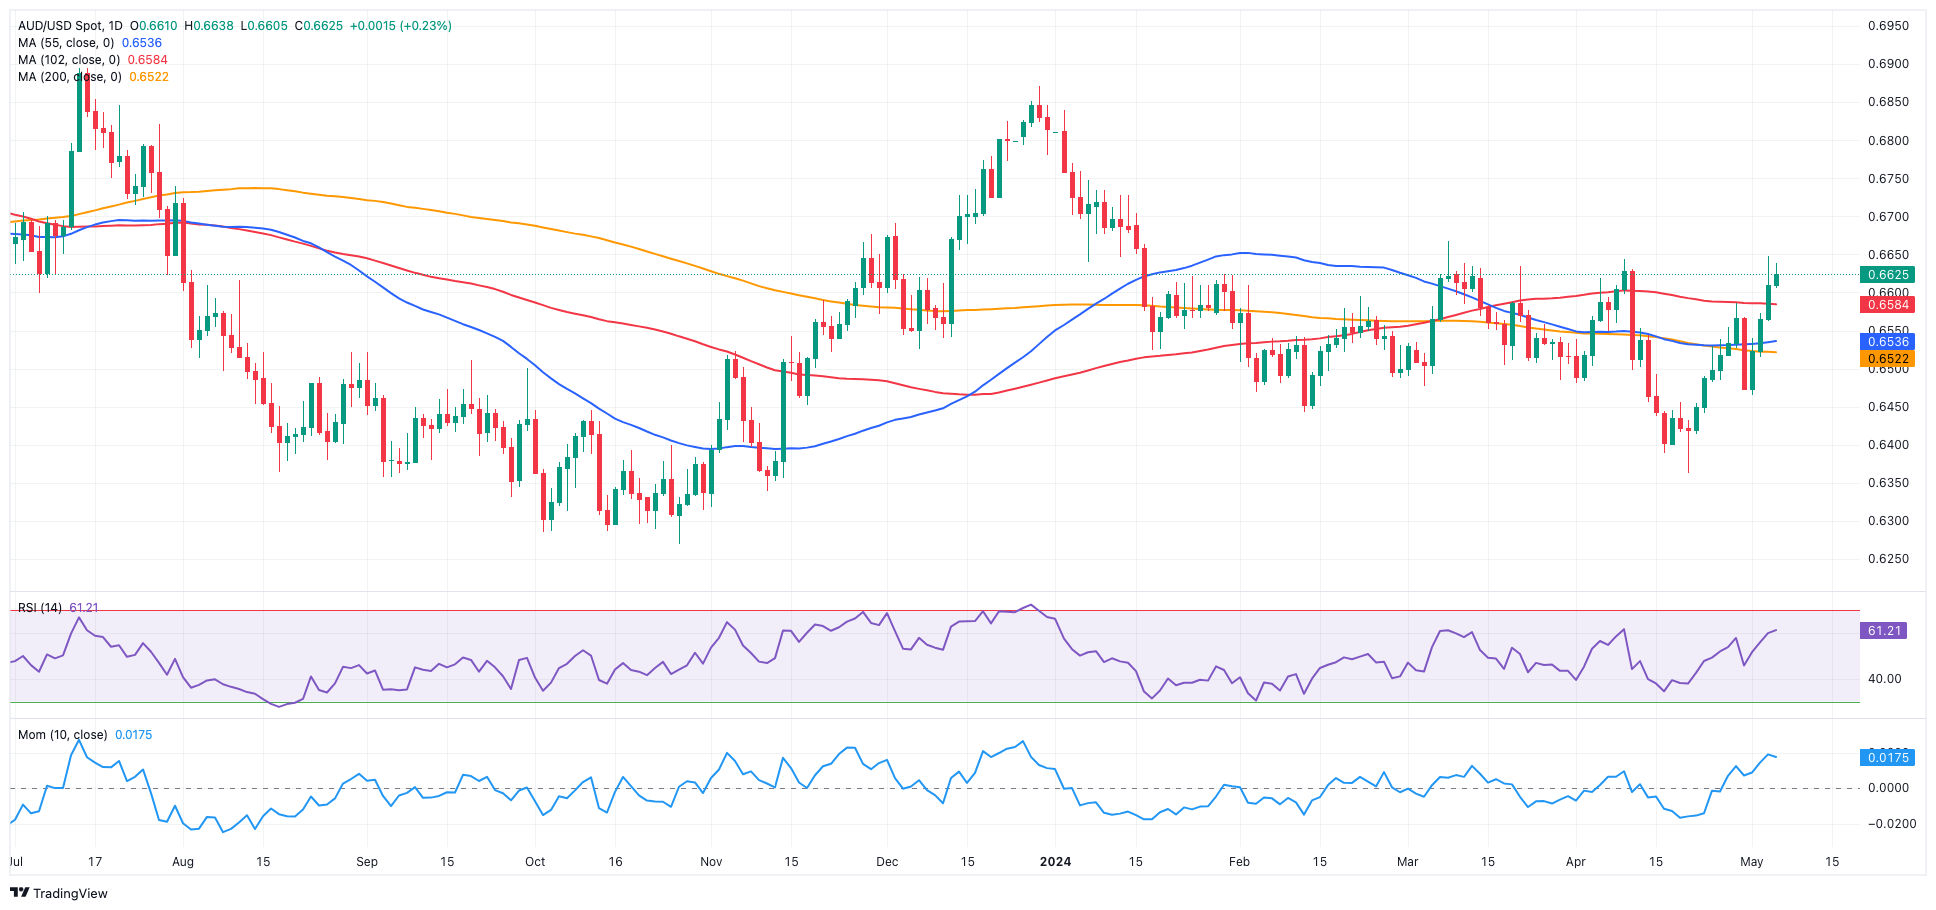
AUD/USD short-term technical outlook
Extra gains may enable the AUD/USD to revisit the May high of 0.6647 (May 3), which comes just ahead of the March top of 0.6667 (March 8) and the December 2023 peak of 0.6871.
Meanwhile, if sellers take control, spot may challenge the key 200-day SMA at 0.6520 prior to the May low of 0.6465 and its 2024 bottom of 0.6362 (April 19).
Looking at the big picture, a sustained break above the important 200-day SMA would almost certainly result in more gains.
On the 4-hour chart, spot looks to have regained bullish momentum. The initial up-barrier develops at 0.6647, ahead of 0.6667. On the downside, the 200-SMA comes at 0.6521 ahead of 0.6465. In addition, the RSI dropped a tad to around 66.
Premium
You have reached your limit of 3 free articles for this month.
Start your subscription and get access to all our original articles.
Author

Pablo Piovano
FXStreet
Born and bred in Argentina, Pablo has been carrying on with his passion for FX markets and trading since his first college years.


