AUD/USD Forecast: Aussie hesitates despite hawkish RBA Minutes

AUD/USD Current Price: 0.6811
- Reserve Bank of Australia Meeting Minutes noted further tightening may be required.
- Wall Street rallied on the back of upbeat earnings reports from big American banks.
- AUD/USD keeps losing steam in the near term, bearish correction once below 0.6780.
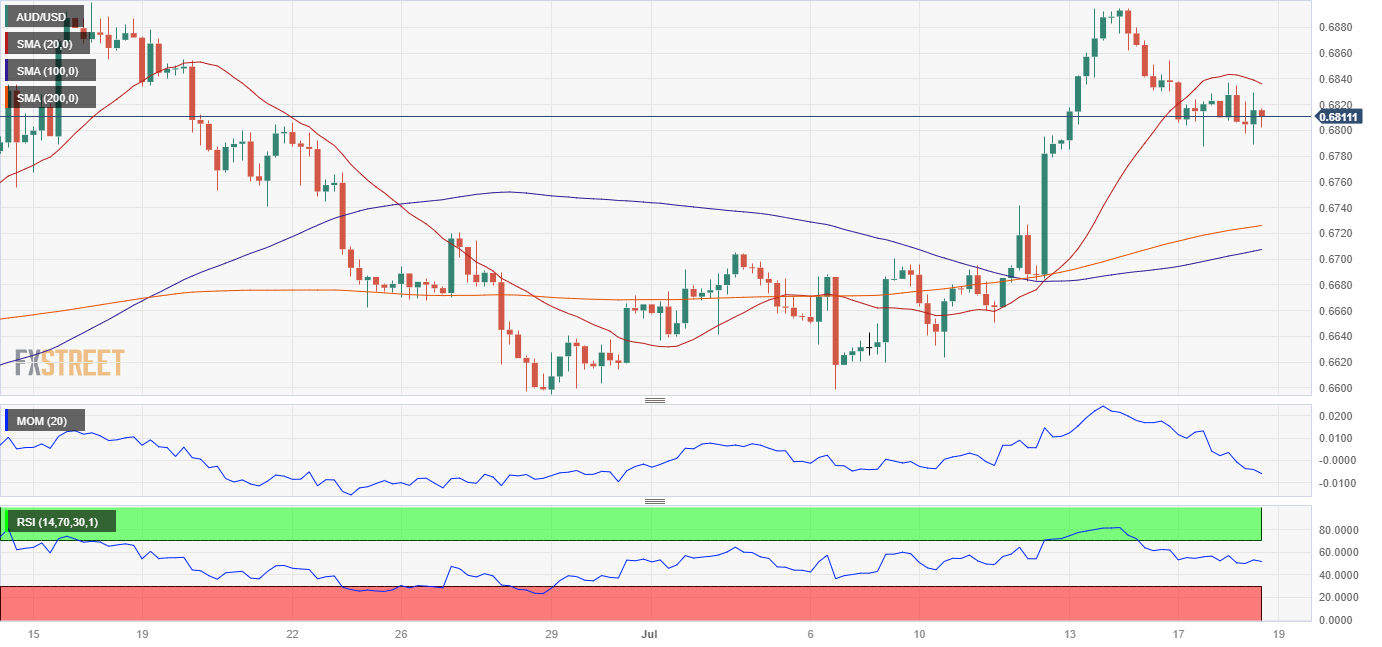
The AUD/USD pair struggled for direction on Tuesday, spending the day seesawing around 0.6814, where it started the day. The pair eased throughout the first half of the day amid a dismal mood and following the release of the Reserve Bank of Australia (RBA) meeting Minutes. The document brought some hawkish surprises, as Australian policymakers agreed some further tightening may be required, adding that “they would reconsider at August meeting.”
Furthermore, authorities reported that a 25 basis points (bps) cash rate hike was on the table and noted that the restrictive monetary policy would become more so. Finally, policymakers said they do not expect inflation to return to the top of the target range until mid-2025.
AUD/USD bottomed at 0.6788 but changed course after Wall Street’s opening, as stocks bounced nicely following upbeat earning reports. Bank of America, Morgan Stanley and Bank of NY Mellon reported figures exceeding expectations and pushing the Dow Jones Industrial Average to its highest for 2023.
Early Wednesday, Australia will release the June CB Leading Index and the Westpac Leading Index for the same month, gauges of economic activity.
AUD/USD short-term technical outlook
The AUD/USD pair trades a few pips in the red ahead of the US close, and the daily chart shows that it remains trapped between Fibonacci levels. To the upside, the 23.6% retracement of the 0.6598/0.6894 rally provides resistance at 0.6825, while support can be found at the 38.2% retracement at 0.6780. Moving averages in the aforementioned time frame remain directionless and within a limited range far below the current level, although technical indicators aim higher with uneven strength above their midlines, limiting chances of a steeper decline.
The upside seems limited in the near term, and according to the 4-hour chart. The 20 Simple Moving Average (SMA) turned south, standing above the current level, while technical indicators are neutral-to-bullish, although within negative levels.
Support levels: 0.6780 0.6740 0.6705
Resistance levels: 0.6825 0.6870 0.6905
Author

Valeria Bednarik
FXStreet
Valeria Bednarik was born and lives in Buenos Aires, Argentina. Her passion for math and numbers pushed her into studying economics in her younger years.