AUD/USD Elliott Wave technical analysis [Video]
![AUD/USD Elliott Wave technical analysis [Video]](https://editorial.fxsstatic.com/images/i/AUDUSD-bearish-animal_XtraLarge.png)
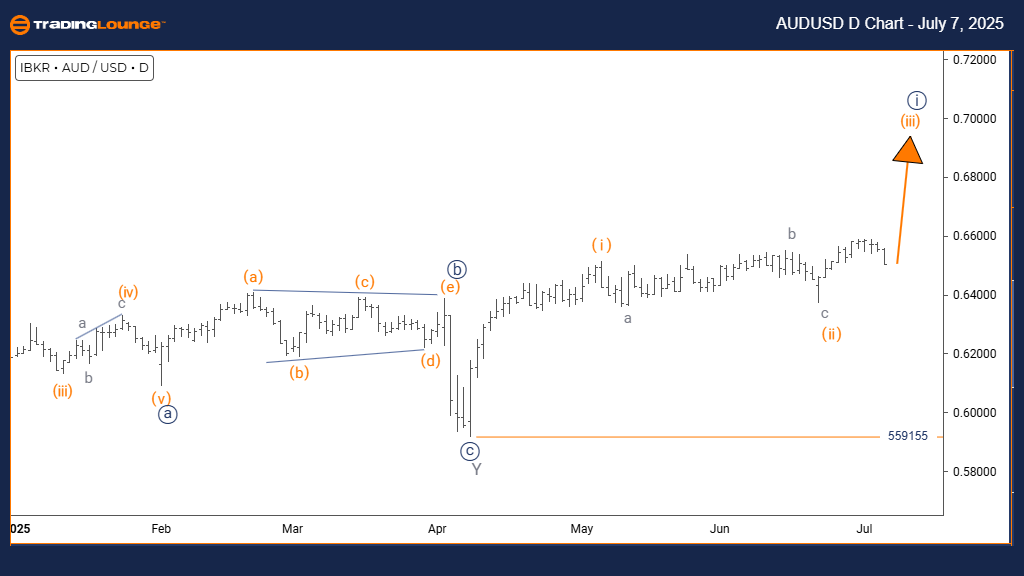
AUD/USD Elliott Wave technical analysis – Day chart
Function: Bullish Trend.
Mode: Impulsive.
Structure: Orange Wave 3.
Position: Navy Blue Wave 1.
Direction next higher degrees: Orange Wave 3 (Initiated).
Details: Orange Wave 2 appears complete; Orange Wave 3 is now active.
Wave cancel invalid level: 0.559155.
The AUDUSD daily Elliott Wave analysis identifies a bullish trend, with current market behavior showing impulsive movement and strong upward momentum. The price action is developing within Orange Wave 3, which is part of the broader Navy Blue Wave 1. This structural position signals the potential beginning of a major upward movement within the existing bullish cycle.
Orange Wave 2 appears to have ended its corrective sequence, with Orange Wave 3 now progressing. This wave is typically the strongest in an Elliott Wave pattern, often delivering the most substantial price advancement. The ongoing development of this wave suggests strong trading opportunities as momentum builds.
A critical invalidation level is set at 0.559155. Any price drop below this threshold would nullify the current wave count and call for a new analysis of the market trend. This level serves as a key reference for managing risk and validating trade positions.
Overall, the current setup points to favorable conditions for bullish trades. As Orange Wave 3 unfolds, traders should monitor for confirmation signals and remain aware of the invalidation level for adjusting strategies if needed.
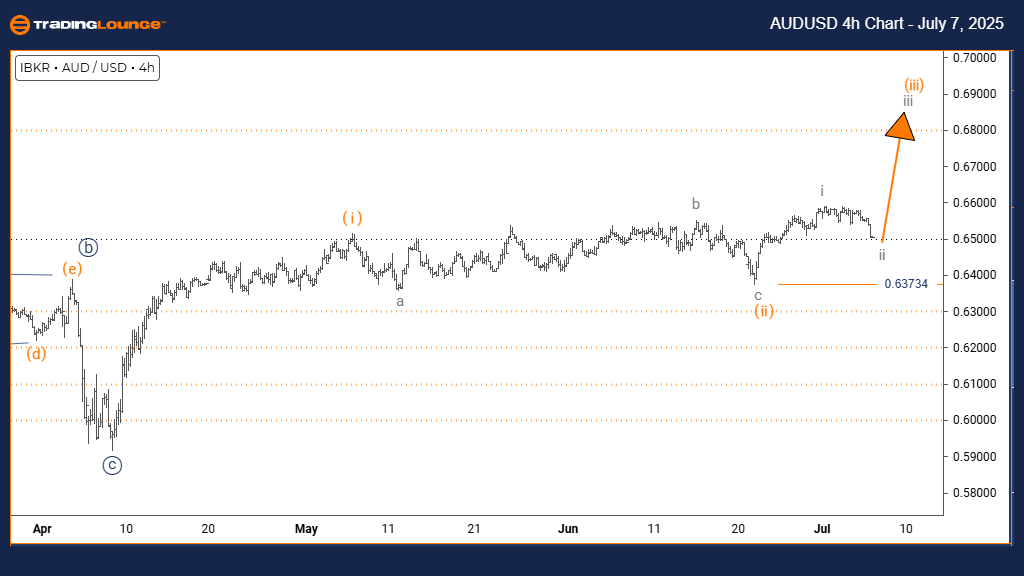
AUD/USD Elliott Wave technical analysis – Four-hour chart
Function: Counter Trend.
Mode: Corrective.
Structure: Gray Wave 2.
Position: Orange Wave 3.
Direction next higher degrees: Gray Wave 3.
Details: Gray Wave 1 appears completed; Gray Wave 2 is now active.
Wave cancel invalid level: 0.63734.
The AUDUSD 4-hour Elliott Wave analysis suggests the pair is undergoing a counter-trend phase, currently in a corrective mode. This implies a temporary pullback against the prevailing upward direction. Price action is progressing through Gray Wave 2, which lies within the intermediate Orange Wave 3 structure.
Gray Wave 1 appears to have concluded, and Gray Wave 2 is developing as a consolidation period. Once completed, the anticipated next move is Gray Wave 3, expected to resume the broader bullish trend. This scenario aligns with common Elliott Wave formations, where corrections often lead to the next impulsive push.
An important technical threshold is the invalidation level at 0.63734. Breaching this point would negate the current wave configuration, demanding a reevaluation of the market outlook. Traders should use this level to guide risk strategies and position management.
This analysis offers a structured method for evaluating potential movements in AUDUSD. By recognizing the wave patterns and monitoring key levels, traders gain insights into market behavior and informed decision-making.
AUD/USD Elliott Wave technical analysis [Video]
Author

Peter Mathers
TradingLounge
Peter Mathers started actively trading in 1982. He began his career at Hoei and Shoin, a Japanese futures trading company.


