AUD/USD Elliott Wave technical analysis [Video]
![AUD/USD Elliott Wave technical analysis [Video]](https://editorial.fxsstatic.com/images/i/AUDUSD-bearish-animal_XtraLarge.png)
AUDUSD Elliott Wave Analysis - Trading Lounge.
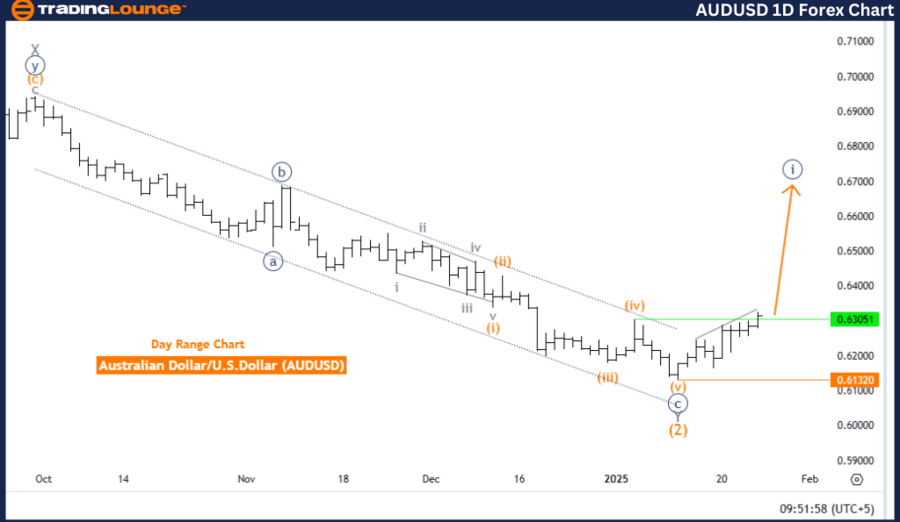
Australian Dollar/U.S. Dollar (AUDUSD) Day Chart.
AUD/USD Elliott Wave technical analysis
-
Function: Bullish Trend.
-
Mode: Impulsive.
-
Structure: Navy Blue Wave 1.
-
Position: Gray Wave 1.
-
Direction (Next lower degree): Navy Blue Wave 2.
-
Invalidation level: 0.61320.
The analysis evaluates the AUDUSD currency pair on a daily chart using Elliott Wave Theory, identifying a bullish trend characterized by an impulsive mode. The primary wave structure under review is navy blue wave 1, which is part of the larger gray wave 1, signaling the onset of a new upward trend in the market.
Currently, navy blue wave 1 is developing within the gray wave 1 structure, indicating strong upward momentum and reinforcing the bullish sentiment. Following the completion of navy blue wave 1, the formation of navy blue wave 2 is expected as the next lower-degree movement. This phase is projected to act as a corrective wave, consolidating prior gains before the trend resumes its upward trajectory.
The invalidation level for this wave count is set at 0.61320, serving as a key benchmark to assess the integrity of the bullish structure. A price movement below this level would necessitate a reassessment of the current wave count and market outlook.
Summary:
The daily AUDUSD chart analysis highlights a positive bullish outlook, supported by the active progression of navy blue wave 1 within gray wave 1. The anticipated development of navy blue wave 2 provides an opportunity to monitor corrective market behavior before the continuation of the upward trend.
The invalidation level is crucial for risk management and ensures alignment with the projected Elliott Wave count. This analysis provides traders with valuable insights into the early stages of a new trend, helping align their trading strategies with the Elliott Wave framework and the ongoing bullish market momentum.
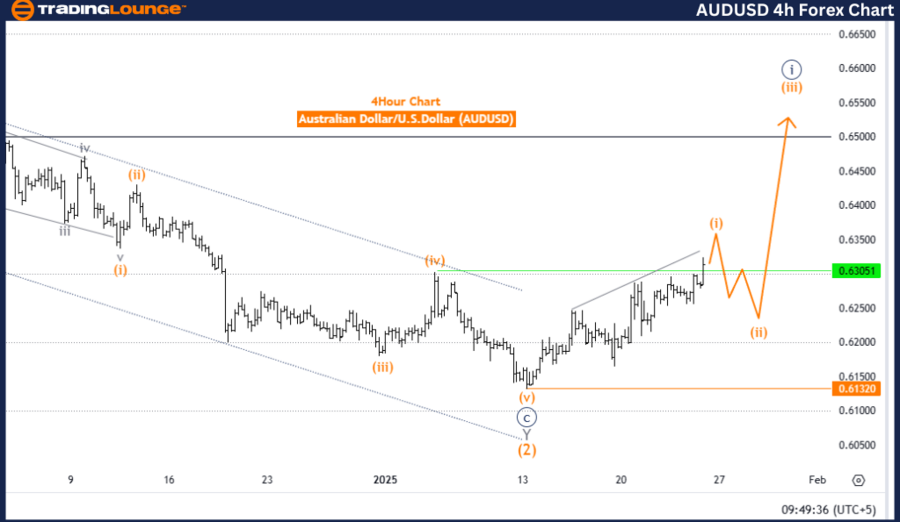
Australian Dollar/U.S. Dollar (AUDUSD) 4-Hour Chart.
AUD/USD Elliott Wave technical analysis
-
Function: Bullish Trend.
-
Mode: Impulsive.
-
Structure: Orange Wave 1.
-
Position: Navy Blue Wave 1.
-
Direction (Next lower degree): Orange Wave 2.
-
Invalidation level: 0.61320.
The analysis assesses the AUDUSD currency pair using Elliott Wave Theory on a four-hour chart, identifying a bullish trend with an impulsive mode. The analysis highlights the active progression of orange wave 1, which forms part of the larger navy blue wave 1, indicating the commencement of a new upward trend in the market.
Currently, orange wave 1 is developing within the navy blue wave 1 structure, signaling strong upward momentum and the initiation of a bullish move. Once orange wave 1 concludes, the emergence of orange wave 2 is anticipated as the next lower-degree movement. This phase is expected to act as a corrective wave, consolidating gains before the trend resumes higher.
The invalidation level for this wave count is set at 0.61320, serving as a critical threshold for verifying the bullish structure. If the price drops below this level, the current wave count would be invalidated, necessitating a revised market outlook.
Summary:
The four-hour AUDUSD chart analysis presents a bullish outlook, supported by the ongoing development of orange wave 1 within navy blue wave 1. The anticipated formation of orange wave 2 offers traders an opportunity to monitor corrective market movements and prepare for potential continuation of the bullish trend.
The invalidation level acts as an essential reference point for risk management and maintaining alignment with the Elliott Wave count. This analysis provides valuable insights into the early stages of a new bullish trend, aiding traders in making informed decisions based on Elliott Wave principles.
Technical analyst: Malik Awais.
AUD/USD Elliott Wave technical analysis [Video]
Author

Peter Mathers
TradingLounge
Peter Mathers started actively trading in 1982. He began his career at Hoei and Shoin, a Japanese futures trading company.


