AUD/USD Elliott Wave technical analysis [Video]
![AUD/USD Elliott Wave technical analysis [Video]](https://editorial.fxstreet.com/images/Markets/Currencies/Majors/AUDUSD/hundred-bucks-3645622_XtraLarge.jpg)
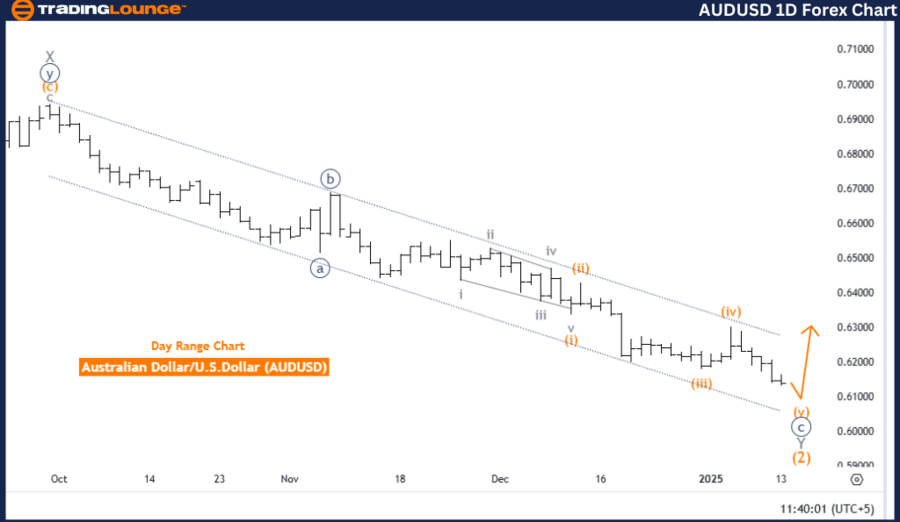
Australian Dollar/U.S. Dollar (AUDUSD) day chart
AUD/USD Elliott Wave technical analysis
-
Function: Counter-trend.
-
Mode: Impulsive as Wave C.
-
Structure: Navy blue Wave C.
-
Position: Gray Wave Y of 2.
-
Next higher degree direction: Orange Wave 1 (New Trend).
Details
The Australian Dollar to US Dollar currency pair (AUDUSD) is currently in a counter-trend phase, as indicated by Elliott Wave Analysis on the daily chart. The market is progressing through an impulsive phase within navy blue Wave C, which is a component of the larger gray Wave Y of 2 structure. This corrective phase appears to be nearing its conclusion, signaling the potential for a market shift.
Navy blue Wave C constitutes the final impulsive wave within the current corrective phase, completing gray Wave Y of 2. This phase is pivotal, as it marks the end of the counter-trend movement and lays the groundwork for the emergence of a new bullish trend. Following the completion of navy blue Wave C, the market is expected to transition into orange Wave 1 of a higher degree, heralding the onset of a fresh trend.
The nearing completion of navy blue Wave C suggests that the counter-trend phase is almost over, paving the way for a potential reversal in market direction. This transitional phase is critical for traders, as it indicates a shift from corrective action to a new impulsive trend that aligns with the broader market dynamics.
Summary
The AUDUSD currency pair is approaching the end of its corrective phase, with navy blue Wave C actively unfolding within gray Wave Y of 2. This phase signifies the culmination of the current counter-trend movement and prepares the market for the expected initiation of a new bullish trend, starting with orange Wave 1. The conclusion of navy blue Wave C highlights a crucial turning point, offering valuable insights into the potential for upward momentum in the market ahead.
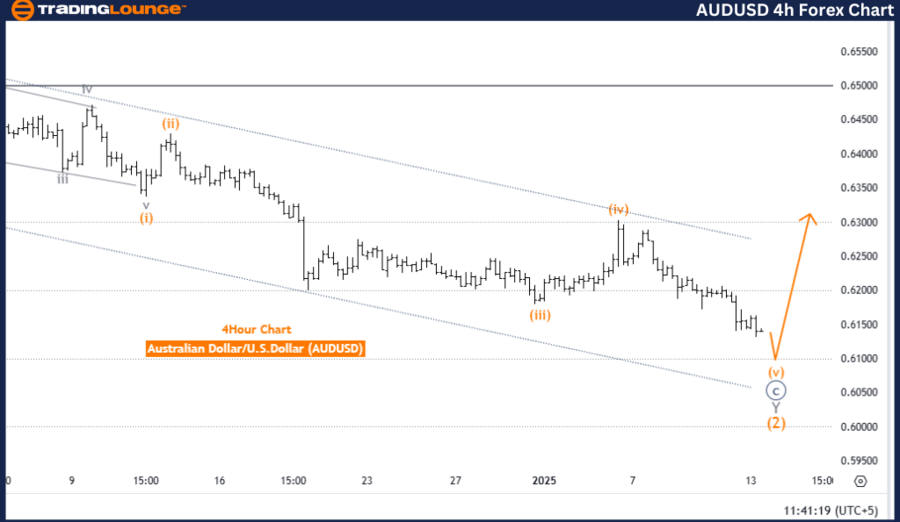
Australian Dollar/U.S. Dollar (AUDUSD) four-hour chart.
AUD/USD Elliott Wave technical analysis
-
Function: Counter-trend.
-
Mode: Impulsive.
-
Structure: Orange Wave 5.
-
Position: Navy Blue Wave C.
-
Next higher degree direction: Orange Wave 1 (New Trend).
Details
The Australian Dollar to US Dollar currency pair (AUDUSD) is currently in a counter-trend phase, as identified by Elliott Wave Analysis on the four-hour chart. The market is in an impulsive stage, represented by orange Wave 5, which is a component of the broader navy blue Wave C structure. The completion of orange Wave 4 has paved the way for orange Wave 5 to develop.
Orange Wave 5 signifies the final impulsive wave in the current sequence and completes the navy blue Wave C corrective structure. Once orange Wave 5 is finalized, it is expected to lay the groundwork for a new bullish trend, beginning with orange Wave 1 of the next higher degree. This transition suggests a potential reversal in market direction, moving away from the ongoing corrective phase toward a new upward trend.
The completion of orange Wave 5 is pivotal, as it will confirm the conclusion of the corrective sequence and the start of a new bullish cycle. The progression through orange Wave 5 will offer insights into the strength and durability of the anticipated upward trend.
Summary
The AUDUSD currency pair is nearing the end of its corrective phase, with orange Wave 5 actively unfolding as part of navy blue Wave C. This stage represents the conclusion of the current counter-trend movement and prepares the market for the anticipated initiation of a new upward trend, starting with orange Wave 1. The development and completion of orange Wave 5 are crucial to confirming the end of the corrective structure and setting the stage for bullish momentum in the market.
AUD/USD Elliott Wave technical analysis [Video]
Author

Peter Mathers
TradingLounge
Peter Mathers started actively trading in 1982. He began his career at Hoei and Shoin, a Japanese futures trading company.


