AUD/USD analysis: Chinese growth data could take the pair out of its range

AUD/USD Current price: 0.7401
- A busy macroeconomic calendar in Asia should make trading around the pair more lively.
- The positive tone of equities' markets keeps the pair afloat, upside capped by softer metals' prices.
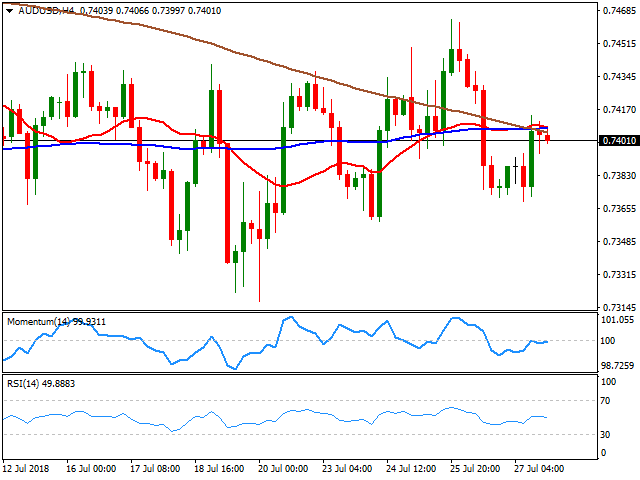
The AUD/USD pair traded uneventfully around the 0.7400 figure for a sixth consecutive week. Despite a better market mood sent US indexes to multi-month highs, as the US and the EU averted a trade war, the pair was unable to run beyond the 0.7440/50 static resistance area, where strong selling interest has been capping advances ever since mid-June. A scarce Australian macroeconomic calendar, as the country only released quarterly inflation figures, added to lack of directional conviction, alongside with persistent weakness in base metals. These upcoming days, China will release its official and Caixin business activity indexes for July, while Australia will offer some housing data, retail sales, and more relevant, the TD Securities Inflation estimates for July. The pair is technically neutral, with sellers around the mentioned 0.7447/50 region and buyers surging on approaches to 0.7300. The daily chart shows that the pair is still neutral, hovering around a flat 20 DMA and with technical indicators back and forth around their midlines, although the pair remains well below a bearish 100 DMA, this last around 0.7520. Shorter term, and according to the 4 hours chart, the technical picture is quite alike, as the pair is trading a few pips below a congestion of moving averages, while indicators head nowhere around their midlines.
Support levels: 0.7370 0.7330 0.7300
Resistance levels: 0.7445 0.7490 0.7520
Author

Valeria Bednarik
FXStreet
Valeria Bednarik was born and lives in Buenos Aires, Argentina. Her passion for math and numbers pushed her into studying economics in her younger years.


