AUD/JPY Elliott Wave technical analysis [Video]
![AUD/JPY Elliott Wave technical analysis [Video]](https://editorial.fxsstatic.com/images/i/AUDUSD-bullish-chart_XtraLarge.png)
AUD/JPY Elliott Wave technical overview
Function: Counter-Trend.
Mode: Impulsive.
Structure: Navy Blue Wave X.
Position: Gray Wave Y.
Direction (Lower degrees): Navy Blue Wave Y.
Details: Navy Blue Wave W appears completed; Navy Blue Wave X is in progress.
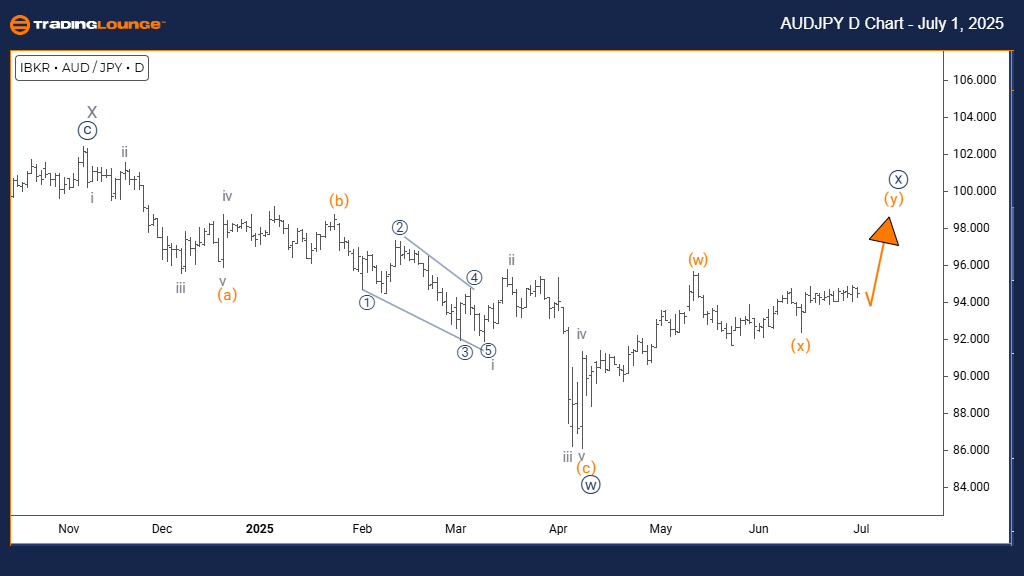
Daily chart summary
The Elliott Wave analysis for the AUDJPY daily chart shows a counter-trend setup. The current price action is impulsive, moving strongly against the main trend. The wave structure is identified as Navy Blue Wave X, which belongs to a broader correction under Gray Wave Y. This setup suggests a potential shift or extension of the corrective phase.
Wave W to X transition
With Navy Blue Wave W completed, the pair has entered Navy Blue Wave X. This wave typically represents part of a complex correction and may develop into a combination pattern. The next anticipated move is Navy Blue Wave Y, which would follow the completion of the ongoing Wave X.
Technical outlook
AUDJPY is positioned for a corrective move, with Wave X now developing after Wave W's conclusion. The impulsive structure of this wave implies strong price momentum. However, this activity remains part of a correction—not the beginning of a new trend direction.
AUD/JPY Elliott Wave technical overview
Function: Counter-Trend.
Mode: Impulsive.
Structure: Orange Wave Y.
Position: Navy Blue Wave X.
Direction (Higher degrees): Orange Wave Y (Continues).
Details: Orange Wave X appears complete; Orange Wave Y is now developing.
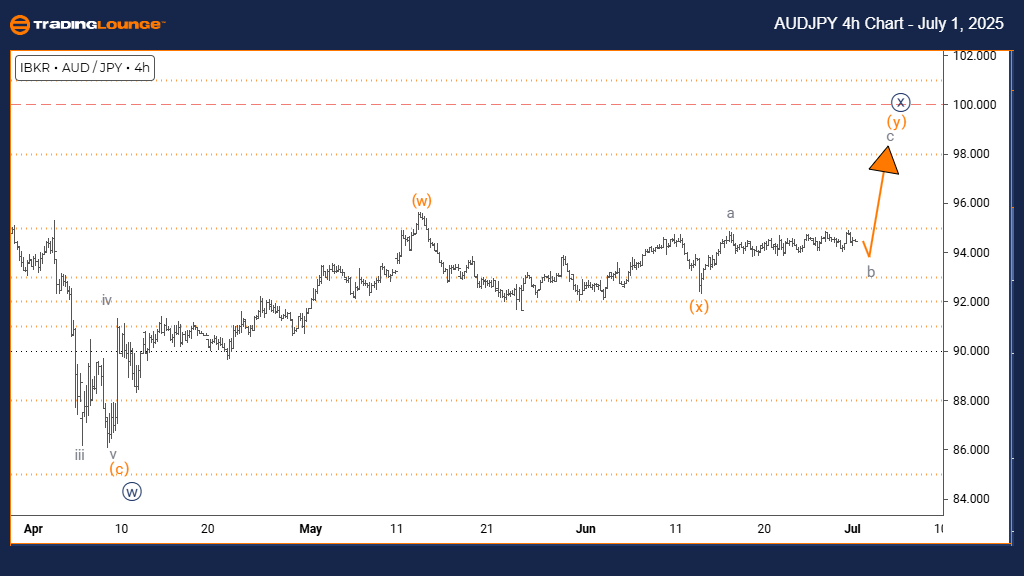
Four-hour chart summary
The 4-hour Elliott Wave analysis of AUDJPY reflects a counter-trend setting. Price action is impulsive, showing strong movement contrary to the main trend. The active structure is Orange Wave Y within a broader correction under Navy Blue Wave X. This formation hints at a potentially extended corrective phase.
Wave x to Y Shift
With Orange Wave x completed, the chart now reflects the progression of Orange Wave Y within Navy Blue Wave X. This stage usually develops into a more structured pattern such as a zigzag or another complex correction.
Technical outlook
The technical structure places AUDJPY in a counter-trend corrective move with active Wave Y. Following the conclusion of Wave x, strong momentum is evident, though it remains part of a broader corrective phase—not a trend reversal. Traders should be cautious and monitor the next development within the pattern.
AUD/JPY Elliott Wave technical overview [Video]
Author

Peter Mathers
TradingLounge
Peter Mathers started actively trading in 1982. He began his career at Hoei and Shoin, a Japanese futures trading company.


