AUD/CHF: Is the pair going to have another bullish day?
AUD/CHF has been bullish on the daily chart. The pair produced an ABC pattern. Upon finding the C point, the price has been heading towards the North with good bullish momentum. Friday's daily candle came out as a bullish candle. Thus, the pair may produce another bullish candle on the daily chart today. The H4 chart looks bullish as well. However, the H1 chart has an equation, which may hold the buyers back to go long on the pair. Let us have a look at those three charts.
Chart 1 AUD/CHF Daily Chart
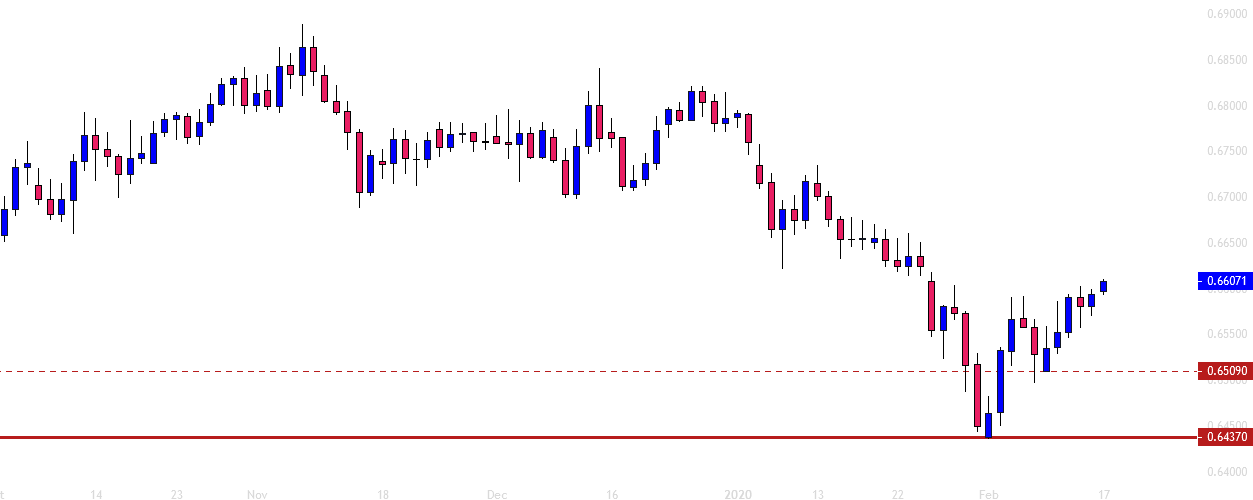
The chart shows that the price had a bounce at the level of 0.64370 and headed towards the North. It then found its resistance and made a bearish correction. The level of 0.65090 held the price and produced a bullish reversal candle. Since then, the price has been heading towards the North again. The price may find its next resistance at the level of 0.67000. Thus, the buyers may keep their eyes on the pair to go long on its weakness.
Chart 2 AUD/CHF H4 Chart
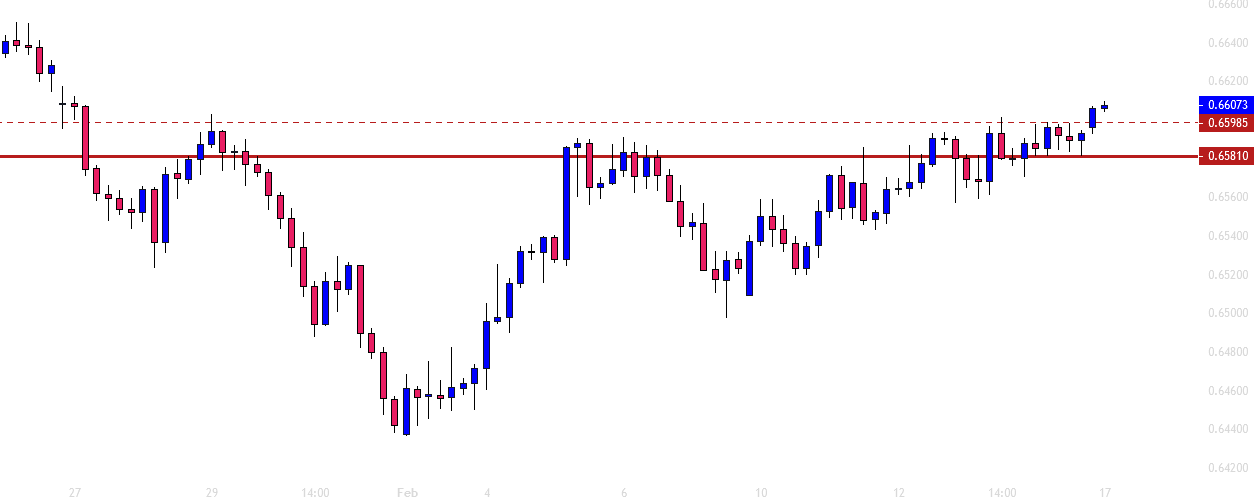
The H4 chart looks very bullish. The price consolidated between the levels of 0.65810 and 0.65985. One of the candles made a breakout at the level of resistance at 0.65985. The pair is trading above the level now. This suggests that the buyers may add their positions and push the price towards the North further. The price may find its next resistance at the level of 0.66500. Since the daily chart is bullish and the daily chart's resistance is further up. Thus, the H4 traders may hold their positions by taking a partial profit.
Chart 3 AUD/CHF H1 Chart
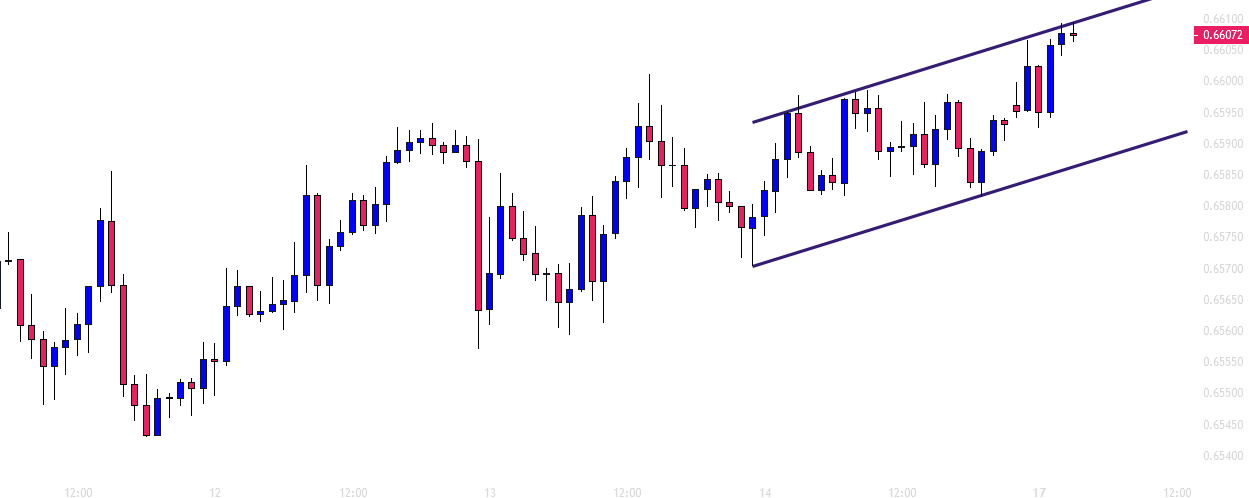
The H1 chart suggests that the price has been bullish, but it is trading right at a level of equidistant channel's resistance. The buyers may take their profit out here and wait for the price correction to go long again. Meanwhile, minor intraday traders may go short on the pair and drive the price towards the South. This sometimes changes the equation. On the other hand, bullishness on the daily and the H4 chart may make the price make a breakout at the level of the equidistant channel. If that happens, the pair may end up having a very bullish day. In case of a bullish breakout on the channel's resistance, the price may find its next resistance at the level of 0.66225. The buyers might have a little advantage here. However, considering these three charts, the pair seems to be in a very interesting position. To sum it up, a lot depends on the intraday charts and intraday breakouts today.
Author

EagleFX Team
EagleFX
EagleFX Team is an international group of market analysts with skills in fundamental and technical analysis, applying several methods to assess the state and likelihood of price movements on Forex, Commodities, Indices, Metals and


