Another Mixed Day

US Dollar: March USD is Down at 96.605.
Energies: April '19 Crude is Up at 58.92.
Financials: The Jun 30 year bond is Up 7 ticks and trading at 145.23.
Indices: The Mar S&P 500 emini ES contract is 24 ticks Higher and trading at 2828.25.
Gold: The April Gold contract is trading Up at 1303.60 Gold is 84 ticks Higher than its close.
Initial Conclusion
This is not a correlated market. The dollar is Down- and Crude is Up+ which is normal and the 30 year Bond is trading Higher. The Financials should always correlate with the US dollar such that if the dollar is lower then bonds should follow and vice-versa. The S&P is Higher and Crude is trading Higher which is not correlated. Gold is trading Higher which is correlated with the US dollar trading Lower. I tend to believe that Gold has an inverse relationship with the US Dollar as when the US Dollar is down, Gold tends to rise in value and vice-versa. Think of it as a seesaw, when one is up the other should be down. I point this out to you to make you aware that when we don't have a correlated market, it means something is wrong. As traders you need to be aware of this and proceed with your eyes wide open.
At this hour all of Asia is trading Higher. Currently all of Europe is trading to the Upside as well.
Possible Challenges To Traders Today
Empire State Manufacturing Index is out at 8:30 AM EST. This is major.
Capacity Utilization Rate is out at 9:15 AM EST. This is major.
Industrial Production is out at 9:15 AM EST. This is major.
Prelim UoM Consumer Sentiment is out at 10 AM EST. This is major.
Prelim UoM Inflation Expectations is out at 10 AM EST. Major.
JOLTS Job Openings is out at 10 AM EST. This is major.
TIC Long-Term Purchases is out at 4 PM EST. This is not major.
Treasuries
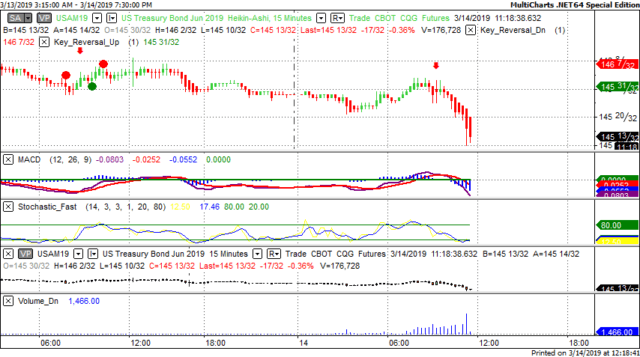
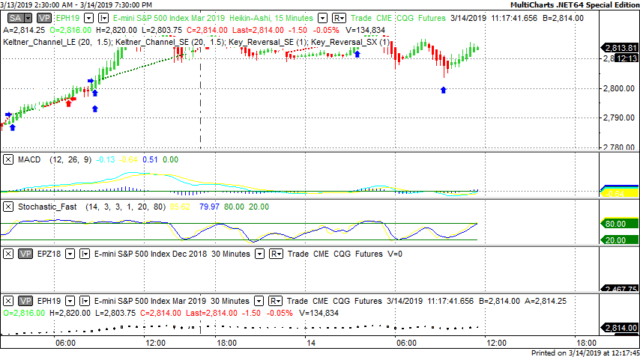
We've elected to switch gears a bit and show correlation between the 30 year bond (ZB) and The YM futures contract. The YM contract is the DJIA and the purpose is to show reverse correlation between the two instruments. Remember it's liken to a seesaw, when up goes up the other should go down and vice versa.
Yesterday the ZB made a major move at around 9:15 AM EST. The ZB hit a High at around that time and the YM hit a Low. If you look at the charts below ZB gave a signal at around 9:15 AM EST and the YM was moving Higher at the same time. Look at the charts below and you'll see a pattern for both assets. ZB hit a High at around 9:15 AM and the YM was moving Higher at the same time. These charts represent the newest version of MultiCharts and I've changed the timeframe to a 15 minute chart to display better. This represented a Shorting opportunity on the 30 year bond, as a trader you could have netted about 20 plus ticks per contract on this trade. Each tick is worth $31.25. Please note: the front month for the ZB contract is now June, 2019
Charts Courtesy of MultiCharts built on an AMP platform.
Bias
Yesterday we gave the markets a Neutral bias as the futures didn't have any sense of direction at all yesterday morning. The Dow gained 7 points but the other indices lost ground. Today we aren't dealing with a correlated market and our bias is Neutral.
Could this change? Of Course. Remember anything can happen in a volatile market.
Commentary
Yesterday as in just about every session this past week we're witnessing Mixed markets like we've never seen before. Typically mixed markets are an occasional phenomena but this week it seems that every session is mixed. We're not exactly sure as to why that is. Could it be the grounding of all Boeing 737 aircraft? Possibly but that usually doesn't go beyond one day. Could it be President Trump's threat to veto a bill? Possibly but again that usually doesn't go beyond a day. I think time will tell the true reason but until that time comes we're going to stick by our rules of market correlation.
Author

Nick Mastrandrea
Market Tea Leaves


