|

Amazon reacting higher from Elliott Wave blue box area

In this technical blog, we are going to take a look at the past performance of 4 hour Elliott Wave Charts of Amazon ticker symbol: $AMZN, which we presented to members. In which, the rally from 16 March 2020 lows, showed the higher high sequence in an impulse structure favored more strength to take place. Also, the right side tag pointed higher & favored more strength. Therefore, we advised our members to buy the dips in Amazon in 3, 7, or 11 swings at the blue box areas. We will explain the structure & forecast below:

Amazon 4 Hour Elliott Wave Chart

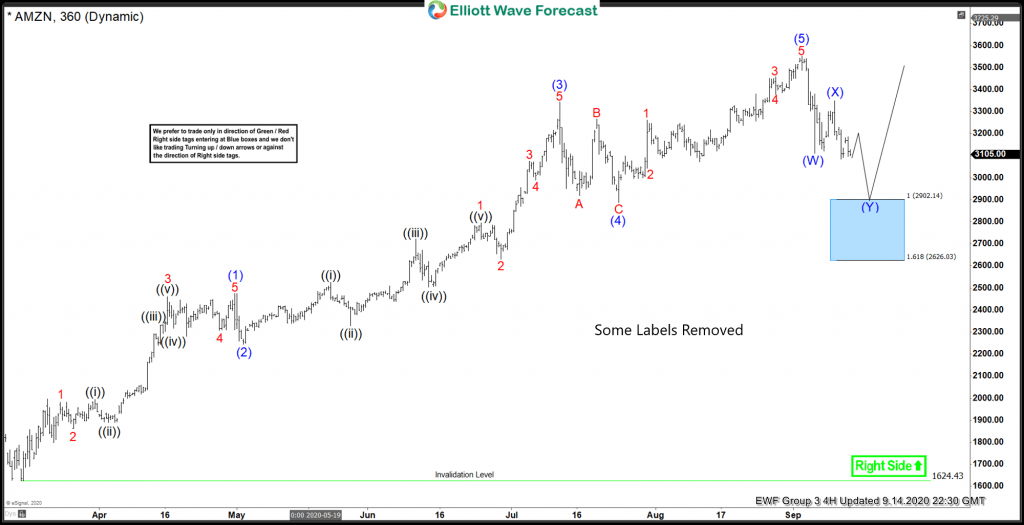
Above is the Amazon 4 hour Elliott Wave Chart from 9/14/2020 update. In which, the rally from 16 March 2020 low unfolded as 5 waves impulse structure where wave (1) ended at $2475 high. Wave (2) ended at $2245 low, wave (3) ended at $3344 high, wave (4) ended at $2888 low. Up from there, wave (5) ended at $3552.25 high and ended the cycle from March lows. Down from there, the stock made a 3 pullback to correct the cycle from 16 March 2020 low. The internals of that pullback unfolded as a double three structure where wave (W) ended at $3111.13 low. Wave (X) bounce ended at $3349.89 high and wave (Y) was expected to reach $2902.14- $2626.03 100%-161.8% Fibonacci extension area of (W)-(X). Before providing a buying opportunity looking for more upside or for 3 wave reaction higher at least.

Amazon 4 Hour Elliott Wave Chart

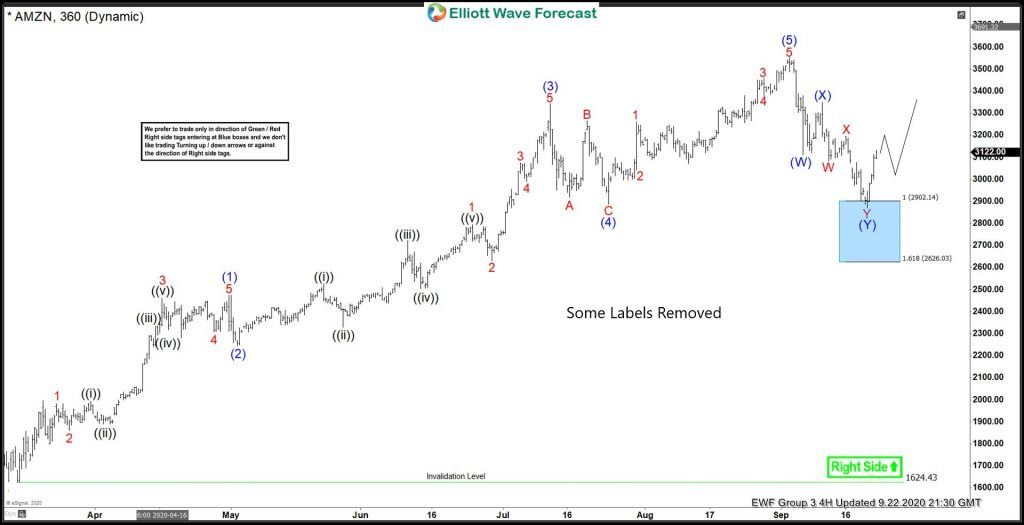
Here’s 4 hour Elliott Wave Chart from 9/22/2020 update, in which the stock managed to reach the blue box area at $2902.14- $2626.03 & showing reaction higher taking place from the blue box area. Allowed members to create a risk-free position shortly after taking the longs at the blue box area. However, a break above $3552.25 high still needed to confirm the next extension higher & avoid double correction lower.

Author

Elliott Wave Forecast Team

Elliott Wave Forecast Team

ElliottWave-Forecast.com

More from Elliott Wave Forecast Team
Share:

Editor's Picks

EUR/USD: US Dollar to remain pressured until uncertainty fog dissipates

Unimpressive European Central Bank left monetary policy unchanged for the fifth consecutive meeting. The United States first-tier employment and inflation data is scheduled for the second week of February. EUR/USD battles to remain afloat above 1.1800, sellers moving to the sidelines.

GBP/USD reclaims 1.3600 and above

GBP/USD reverses two straight days of losses, surpassing the key 1.3600 yardstick on Friday. Cable’s rebound comes as the Greenback slips away from two-week highs in response to some profit-taking mood and speculation of Fed rate cuts. In addition, hawkish comments from the BoE’s Pill are also collaborating with the quid’s improvement.

Gold: Volatility persists in commodity space

After losing more than 8% to end the previous week, Gold remained under heavy selling pressure on Monday and dropped toward $4,400. Although XAU/USD staged a decisive rebound afterward, it failed to stabilize above $5,000. The US economic calendar will feature Nonfarm Payrolls and Consumer Price Index data for January, which could influence the market pricing of the Federal Reserve’s policy outlook and impact Gold’s performance.

Week ahead: US NFP and CPI data to shake Fed cut bets, Japan election looms

US NFP and CPI data awaited after Warsh’s nomination as Fed chief. Yen traders lock gaze on Sunday’s snap election. UK and Eurozone Q4 GDP data also on the agenda. China CPI and PPI could reveal more weakness in domestic demand.

Three scenarios for Japanese Yen ahead of snap election

The latest polls point to a dominant win for the ruling bloc at the upcoming Japanese snap election. The larger Sanae Takaichi’s mandate, the more investors fear faster implementation of tax cuts and spending plans. 

XRP rally extends as modest ETF inflows support recovery

Ripple is accelerating its recovery, trading above $1.36 at the time of writing on Friday, as investors adjust their positions following a turbulent week in the broader crypto market. The remittance token is up over 21% from its intraday low of $1.12.