|

AMAZON Elliott Wave View: Close Finding Support?

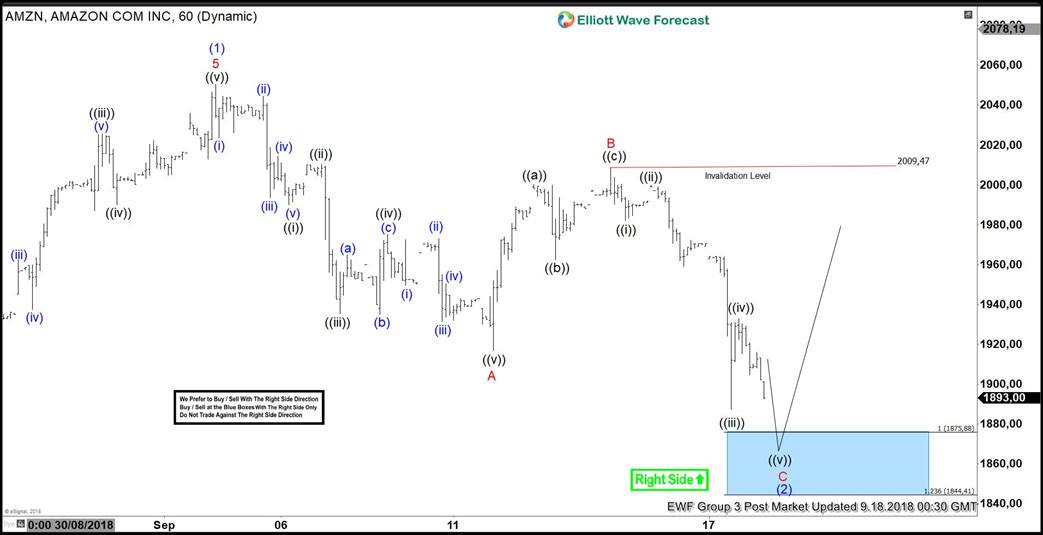
AMAZON ticker symbol: AMZN short-term Elliott wave view suggests that the rally to $2050.50 high ended intermediate wave (1) as impulse structure. Down from there, the instrument is doing a pullback in intermediate wave (2). The internals of that pullback unfolding in 3 swing structure with the sub-division of 5-3-5 structure in lesser degree cycles thus favored it to be a zigzag correction.

Below from $2050.50 high, the initial decline to $1917 low ended Minor wave A lower in 5 waves structure. The minute wave ((i)) ended at $1989.89, Minute wave ((ii)) ended at $2010.30 high. Minute wave ((iii)) ended at $1935.21 low and Minute wave ((iv)) bounce ended at $1975.20 high. Then finally a move lower to $1917 low ended Minute wave ((v)) of A. Up from there, the 3 wave bounce to $2009.47 high ended Minor wave B bounce as a zigzag correction.

Down from there, the decline lower in Minor wave C is taking place in another 5 waves structure looking to reach $1875.88-$1844.41 100%-123.6% Fibonacci extension area of Minor wave A-B. Afterwards, the stock is expected to resume the upside in intermediate wave (3) higher ideally or should find support for 3 wave bounce at least. Alternatively, if it exceeds below the 161.8% Fibonacci extension area A-B at $1791.89 then the decline from $2050.50 high could become impulsive structure & could be doing a bigger pullback. We don’t like selling it.

AMAZON 1 Hour Elliott Wave Chart

chart
chart

Become a Successful Trader and Master Elliott Wave like a Pro. Start your Free 14 Day Trial at - Elliott Wave Forecast.


Author

Elliott Wave Forecast Team

Elliott Wave Forecast Team

ElliottWave-Forecast.com

More from Elliott Wave Forecast Team
Share:

Editor's Picks

EUR/USD hits two-day highs near 1.1820

EUR/USD picks up pace and reaches two-day tops around 1.1820 at the end of the week. The pair’s move higher comes on the back of renewed weakness in the US Dollar amid growing talk that the Fed could deliver an interest rate cut as early as March. On the docket, the flash US Consumer Sentiment improves to 57.3 in February.

GBP/USD reclaims 1.3600 and above

GBP/USD reverses two straight days of losses, surpassing the key 1.3600 yardstick on Friday. Cable’s rebound comes as the Greenback slips away from two-week highs in response to some profit-taking mood and speculation of Fed rate cuts. In addition, hawkish comments from the BoE’s Pill are also collaborating with the quid’s improvement.

Gold climbs further, focus is back to 45,000

Gold regains upside traction and surpasses the $4,900 mark per troy ounce at the end of the week, shifting its attention to the critical $5,000 region. The move reflects a shift in risk sentiment, driving flows back towards traditional safe haven assets and supporting the yellow metal.

Crypto Today: Bitcoin, Ethereum, XRP rebound amid risk-off, $2.6 billion liquidation wave

Bitcoin edges up above $65,000 at the time of writing on Friday, as dust from the recent macro-triggered sell-off settles. The leading altcoin, Ethereum, hovers above $1,900, but resistance at $2,000 caps the upside. Meanwhile, Ripple has recorded the largest intraday jump among the three assets, up over 10% to $1.35.

Three scenarios for Japanese Yen ahead of snap election

The latest polls point to a dominant win for the ruling bloc at the upcoming Japanese snap election. The larger Sanae Takaichi’s mandate, the more investors fear faster implementation of tax cuts and spending plans. 

XRP rally extends as modest ETF inflows support recovery

Ripple is accelerating its recovery, trading above $1.36 at the time of writing on Friday, as investors adjust their positions following a turbulent week in the broader crypto market. The remittance token is up over 21% from its intraday low of $1.12.