All that glitters is Gold: Bullish trend emerging

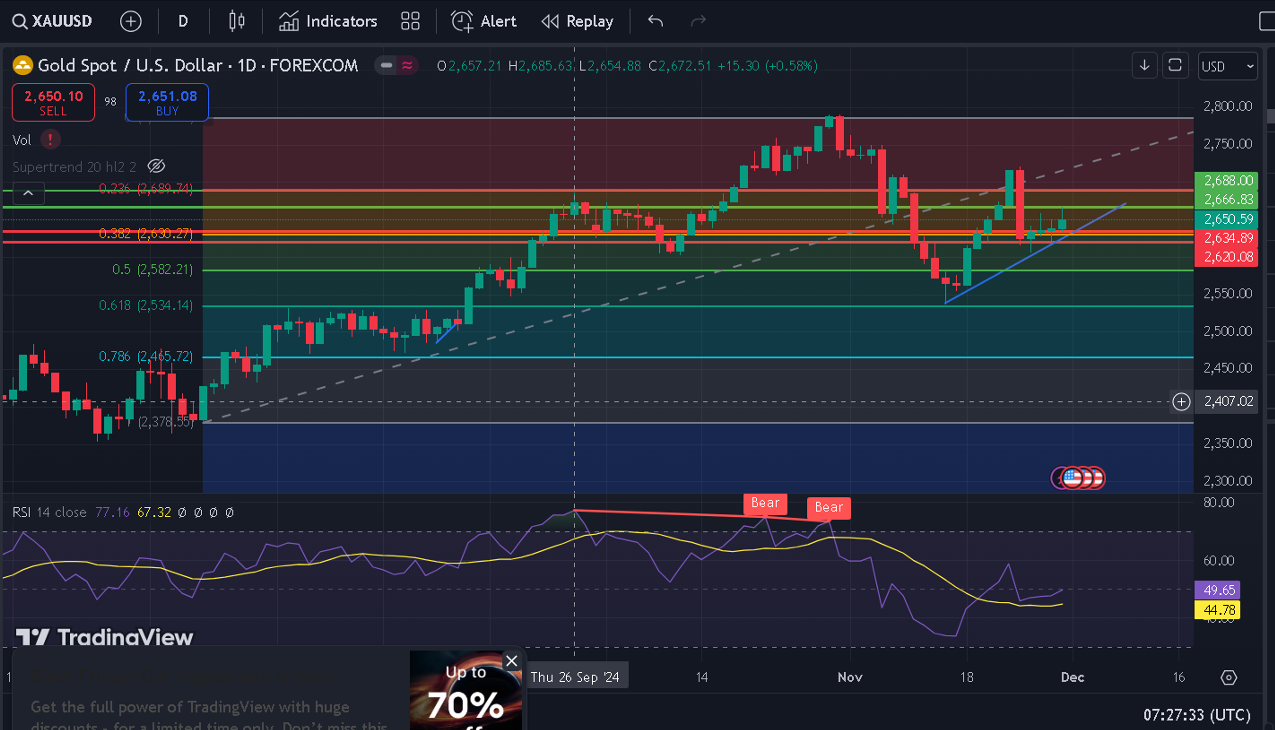
Gold (XAU/USD) has been showing promising signs of bullish momentum. Following a sharp decline early in the week due to geopolitical concerns, the metal has steadily recovered, forming a pattern of higher highs and higher lows—clear indicators of an upward trend. The suggestion to "buy on dips" aligns with this technical setup, as gold seems poised to rally further if key levels are breached.
Technical indicators
RSI (Relative Strength Index):
Positioned above the midline on the 4-hour chart, indicating bullish sentiment and strong upward momentum.
50 EMA (Exponential Moving Average):
Acting as a dynamic support, reinforcing the bullish trend by cushioning price pullbacks.
MACD (Moving Average Convergence Divergence):
Displays upward momentum with a relatively strong histogram volume, affirming potential for further price increases.
Key support and resistance levels
Resistance:
$2665-$2668: Immediate resistance zone. A sustained break here could propel prices toward $2688-$2692.
$2710 and higher: If momentum persists, the next resistance could be tested.
Support:
$2634-$2628: Initial support. A break below may lead to declines toward $2621-$2618.
$2605: Stronger support zone below $2618, where buying interest may re-emerge.
Economic data to watch
Upcoming U.S. economic indicators could heavily influence market dynamics:
- ISM Manufacturing & Services PMI
- Non-Farm Payrolls (NFP) and Unemployment Rate
- Average Hourly Earnings
- JOLTS Job Openings
- UoM Consumer Sentiment & Inflation Expectations
These data points could shape expectations for U.S. Federal Reserve policy, impacting gold's movement.
Trading strategy
Buy opportunities: Enter long positions on dips near support zones ($2634-$2628), targeting resistance at $2665 and beyond.
Risk management: Use stop-loss levels below $2605 to protect against downside risk.
Monitor key events: Stay vigilant around the release of economic data, which could induce volatility and influence short-term price action.
This bullish outlook is supported by technical indicators and broader market conditions. Active traders and investors should maintain a watchful eye on resistance levels and economic data for confirmation of sustained bullish momentum.
Author

Harish Shahi
Indian Market View
Harish Shahi did MBA in Energy Trading and he is a seasoned Head of Research in Commodity and Equity Domain. He contributed his view on difference financial news channels like ET Now Swadesh, Zee Business, NDTV Profit .


