All eyes on Jerome Powell’s speech

The VIX index, a key measure of fear in the U.S. equity market, plummeted by over 20%, indicating a rising risk-on sentiment. Markets are waiting for the Federal Reserve's future monetary policy decisions.
The VIX index, a key measure of fear in the U.S. equity market, plummeted by over 20% in November, indicating a rising risk-on sentiment among investors. However, market activity remained subdued recently as investors eagerly anticipated Jerome Powell's speech scheduled for later today. Against the backdrop of declining U.S. long-term treasury yields, market participants are keenly seeking hints about the Federal Reserve's future monetary policy decisions. Oil prices continued to experience downward pressure due to deteriorating demand from China coupled while oil supplies remain ample. Conversely, Bitcoin (BTC) prices surged to $36,000, reaching levels not seen since May, driven by optimistic expectations regarding the approval of a Spot BTC ETF application by the Securities and Exchange Commission (SEC).
Market movements
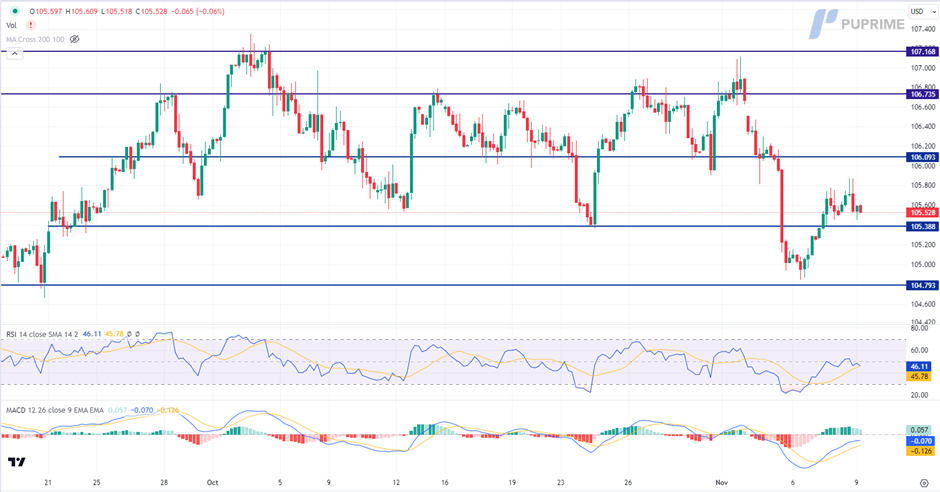
Dollar Index
The US Dollar is in a consolidation phase as markets eagerly await Fed Chair Jerome Powell's statement. Following a significant selloff last week, the Greenback's appeal remains weak. Many economists anticipate a slowdown in the US economy for the fourth quarter, dampening hopes for further Fed rate hikes. Powell refrained from commenting on monetary policy in his recent speech, leaving investors on edge for any forthcoming signals from the Federal Reserve.
The Dollar Index is trading flat while currently testing the support level. MACD has illustrated diminishing bullish momentum, while RSI is at 46, suggesting the index might extend its losses after its breakout below the support level since the RSI stays below the midline.
Resistance level: 106.10, 106.75.
Support level: 105.40, 104.80.
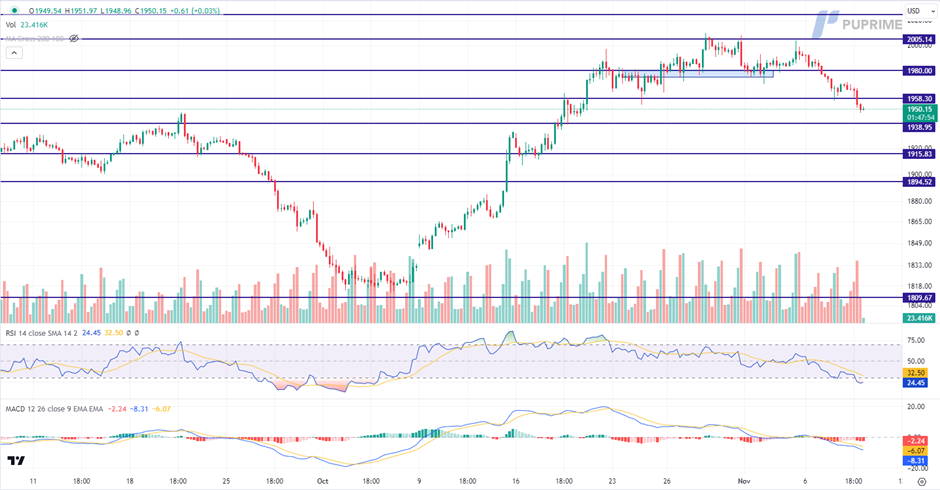
XAU/USD
Gold prices continue to slide as a prevailing risk-on sentiment dominates global financial markets. Hopes for improved US-China relations have shifted sentiment toward higher-risk assets. Anticipation of a key meeting between US President Joe Biden and Chinese leader Xi Jinping at the Asia-Pacific Economic Cooperation summit in San Francisco has fostered optimism. Recent high-level meetings between the two nations have sent positive signals to the world.
Gold is trading lower following the prior breakout below the previous support level. MACD has illustrated increasing bearish momentum. However, RSI is at 24, suggesting the commodity might enter oversold territory.
Resistance level: 1960.00, 1980.00.
Support level: 1940.00, 1915.00.
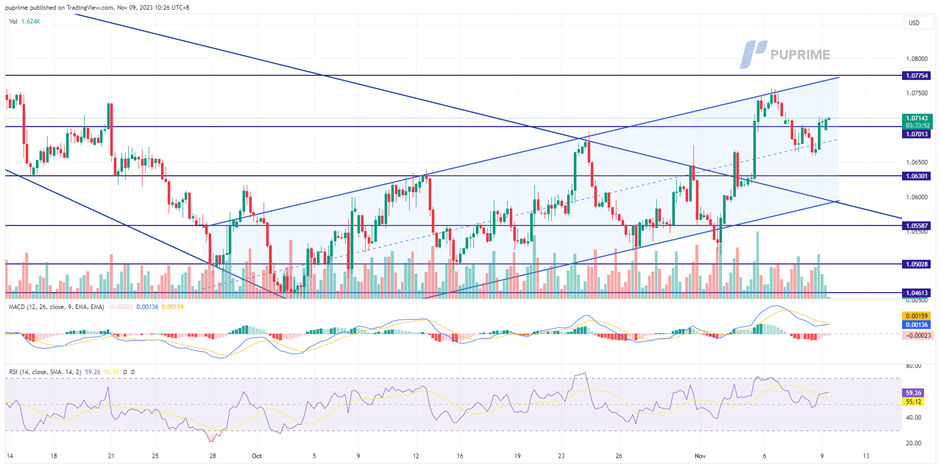
EUR/USD
The strength of the U.S. dollar decreased yesterday in anticipation of Jerome Powell's much-awaited speech scheduled for later today. Investors worldwide are hanging on his word, hoping to glean insights into the Federal Reserve's upcoming monetary policy decisions. In Europe, Germany's Consumer Price Index (CPI), disclosed yesterday, aligned perfectly with market forecasts. The CPI figure stood at an elevated level, leading market analysts to speculate on a potential rate hike from the European Central Bank (ECB). Eyes are now turned to the ECB's chair, who is anticipated to address this topic in her speech later today.
EUR/USD trades rebounded yesterday on the softening dollar and remain within its uptrend channel. The RSI is flowing in an elevated region while the MACD has signs of crossing above the zero line, suggesting a bullish momentum might be forming.
Resistance level: 1.0775, 1.0866.
Support level: 1.0630, 1.0560.
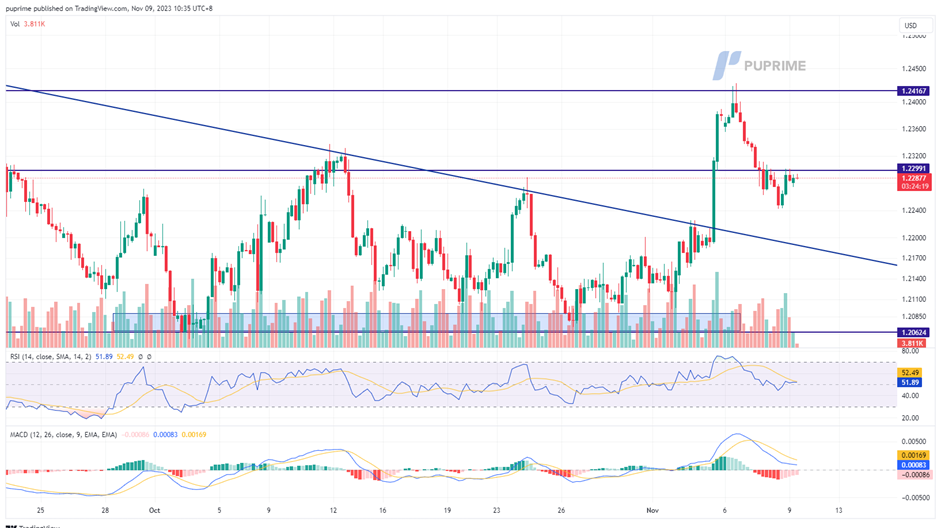
GBP/USD
The British Pound faced a setback, unable to maintain its stronghold above the crucial support level of 1.2300. It trades below this threshold, signalling a potential shift from its bullish trajectory. A respite for the Sterling came as U.S. Treasury yields dipped below 4.5% yesterday, easing some of the bearish pressure. Investor attention is now focused on the upcoming speech by the Federal Reserve's chair, scheduled for later today. Simultaneously, the market is keeping a keen eye on the release of the UK's Gross Domestic Product (GDP) data tomorrow. Both events are poised to be pivotal moments for Cable, shaping its direction amidst ongoing market volatility.
The Cable retraced sharply since Monday and is currently trading below its then-support level, suggesting a bearish signal for Cable. The RSI flowed flat while the MACD eased from declining, suggesting the bearish momentum is eased.
Resistance level: 1.2300, 1.2410.
Support level: 1.2060, 1.1830.
Dow Jones
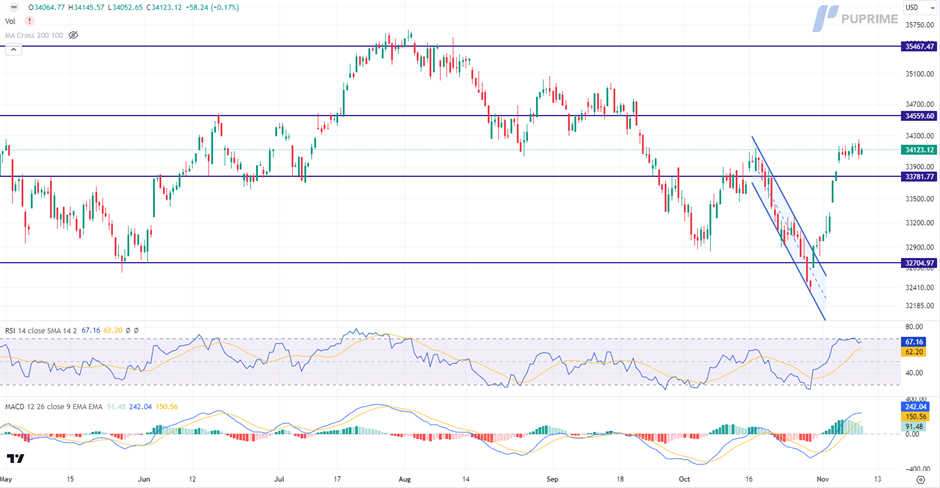
The US equity market continues its bullish run, although the pace has slowed. Investors are eagerly anticipating a clearer monetary policy statement from the Federal Reserve. This follows a notable retreat in US Treasury yields since late October when the 10-year Treasury yields touched 5%. The expectation that the central bank may be nearing the end of its rate-hike cycle gained momentum, fueled by comments from several Fed officials and softer labour data.
The Dow is trading higher following the prior breakout above the previous resistance level. However, MACD has illustrated diminishing bullish momentum, while RSI is at 67, suggesting the index might enter overbought territory.
Resistance level: 34560.00, 35465.00.
Support level: 33780.00, 32705.00.
BTC/USD
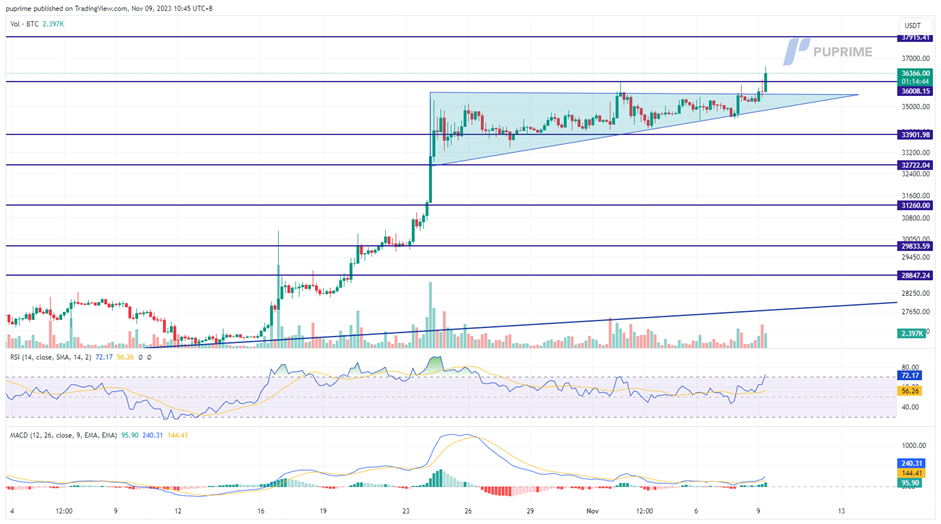
BTC prices surged, reaching the significant milestone of $36,000, a level not seen since last May. This remarkable uptick is fueled by heightened optimism surrounding the potential approval of the Spot BTC ETF by the SEC before the close of 2023. The positive sentiment in the crypto market is further bolstered by the weakening strength of the dollar, which continues to provide essential support for BTC prices.
BTC broke above the bullish flag price pattern, given a bullish signal. RSI is moving upward and is on the brink of breaking into the overbought zone, while the MACD rebounded from above the zero line, suggesting the bullish momentum is picking up.
Resistance level: 37900, 39760.
Support level: 33900, 32700.
USD/CHF
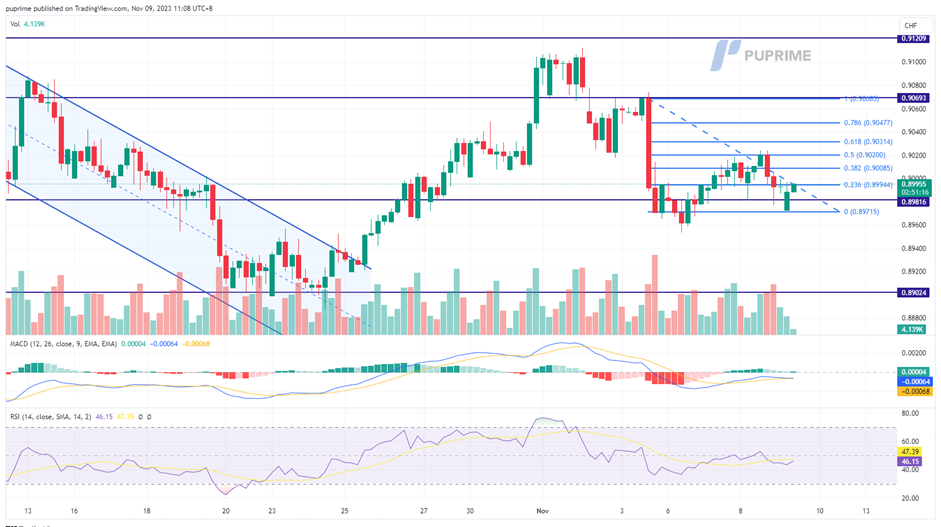
The Swiss Franc has exhibited resilience against the dollar at the beginning of November, even as the dollar staged a comeback, hampering the Franc's momentum. Notably, the U.S. made a significant move by removing Switzerland from its list of monitored countries, relieving it from allegations of currency manipulation. The Swiss National Bank (SNB) engaged in substantial foreign currency purchases to counter the appreciation of safe-haven currency. However, the U.S. action might pose a challenge for the SNB, potentially restricting its ability to influence the valuation of the Swiss Franc. This development could further strengthen the Swiss Franc in the currency market.
The pair experienced a technical rebound, but it is still kept below the Fibonacci 61.8% level, suggesting the bearish momentum is still intact. RSI hovering flat while the MACD is flowing below the zero line, suggesting the bearish momentum is still intact with the pair.
Resistance level: 0.9070, 0.9120.
Support level: 0.8900, 0.8827.
CL Oil
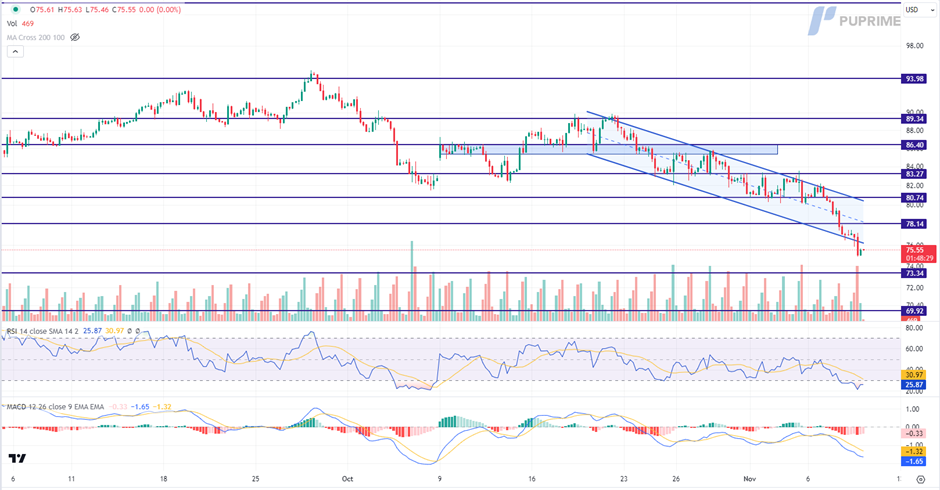
Oil prices have endured a second consecutive day of losses, sinking to four-month lows. This downturn is driven by a gloomy global economic outlook, with major nations like the US, UK, EU, and China contributing to a decreased appetite for oil. Delays in the release of weekly US inventory data by the Energy Information Administration, as they rework their data methodology, have added to the uncertainty. As the meantime, investors are digesting the American Petroleum Institute's inventory data, which revealed a staggering increase of nearly 12 million barrels, vastly exceeding expectations of 300,000 barrels.
Oil prices are trading lower following the prior breakout below the previous support level. However, MACD has illustrated diminishing bearish momentum, while RSI is at 26, suggesting the commodity might enter oversold territory.
Resistance level: 78.15, 80.75.
Support level: 73.35, 69.90.
Author

PU Prime team
PU Prime
PU Prime is an award-winning CFD broker offering clients access to multiple products across multiple asset classes. Traders will have access to FX, Commodities, Indices, Share CFDs and Bonds.
















