A Message to the Gold Bulls: Relying on the CoT Gives You A False Sense of Security

Gold stocks have repeated their decline once again yesterday while gold and silver soldier on. When will the miners take gold and silver down with them? Underperformance is a critical sign of weakness, there's no denying that. Would today's Fed policy pronouncements provide the spark? These are valid questions that we answer for our subscribers on an everyday basis. For you, dear visitor, we have explored everyone's favorite subject: the CoT report. You won't get a chance to get bored while waiting for the pieces of today's puzzle to fall where they belong. While an evergreen, today from an angle you probably haven't heard before anywhere else. Get wiser and benefit!
Having discussed the very recent developments, we would like to once again discuss the issue of the CoT reports and their predictive power. Once again, because we dedicated the very first analysis of this year to this matter. The bottom line is that CoT's usefulness as a trading signal has decreased greatly over time and it's not wise to read too much into it anymore. Our subscribers know the full reasoning already as we wanted to have something to link to whenever we receive more CoT-related questions and comments in order to put it all in the proper context. The thing that we will discuss today is what we recently received about the part of the CoT report – the money managers' positions.
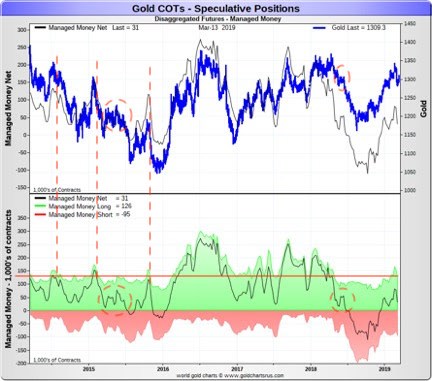
The upper part of the chart features the price of gold and the lower part of the chart shows the futures positions of the money managers on COMEX. The green area represents the long positions, while the red area represents the short positions. The black line shows the net positions (longs minus shorts).
This chart shows high correlation between gold and the net positions of money managers. Both have been moving in very close tune in the last few years. We were informed that this supposedly proves or indicates that gold price is manipulated. The moves being so highly correlated, so it must indicate that the money managers are responsible for gold's price moves – right?
Did you know that the stock market returns are (inversely) correlated with the length of women's skirts? Does it prove or indicate that the stock market movement is manipulated by skirt producers, skirt buyers, or skirt users?
Ummm... There must be some other explanation, I guess...
Of course there is – in both cases. The above link provides some possible explanations behind the skirt correlation and the other possible explanation is that stocks tend to move higher in the first half of the year. Most trading is done in the northern hemisphere, which means that it gets warmer in spring and thus short skirts are becoming more popular. In other words, the above may be just a fancy way to describe a regular market stock market seasonality.
In case of gold price, the explanation is even simpler. Investors' sentiment moves along with price. This applies to both: professional and amateur investors. And... That's it. This is enough to explain the high correlation between the money managers' positions and the price of gold. As the price moves higher, investors get more confident and add to their positions and/or other investors become convinced that the price is going to move higher and enter the market.
But shouldn't the professionals be more market-neutral? The investment public can be biased towards long positions, but the professionals shouldn't.
It's true that the investment public favors long positions, but the same can be said about the market professionals. The extent is not as big as in case of the former, but the tendency is still in place.
One reason is that when one's running an investment service that allows shorting (for instance a private gold fund), they still have to adhere to the fund's mandate. If it's a gold fund, the odds are that it was presented as being a proxy for gold. Fund clients – often private investors – are likely going to favor a situation in which the fund invests in tune with the underlying market, not against it. This means that the fund manager and/or owner will be rewarded (more clients attracted) if they move in tune with the underlying asset. In our case, it would mean being mostly long gold.
Very few people will have clients that understand that at times it's a good idea to either get out of the market or even temporarily enter a position against it, and even fewer money managers will have the courage to do so, even if they think that it's a wise decision. Investors may not be willing to forgive a wrong decision that moves against their favorite market, but they would be more willing to forgive a wrong decision that's in tune with their favorite market. This is really the case and we know this from our experience. We are blessed with clients who understand our approach, but we also know that if we simply followed the always-buy-gold mantra we would have bigger following. In our Alerts, we regularly choose doing what appears to be more profitable in the end, not what is more pleasant to read, but we know that it's difficult and thus the natural drift toward long positions among money managers is perfectly understandable.
Just like there was a more believable explanation behind the stock-skirt manipulation theory, there is one for high correlation between gold and money managers' positions. And the correlation is not as high in the very long run as the last few years might indicate.
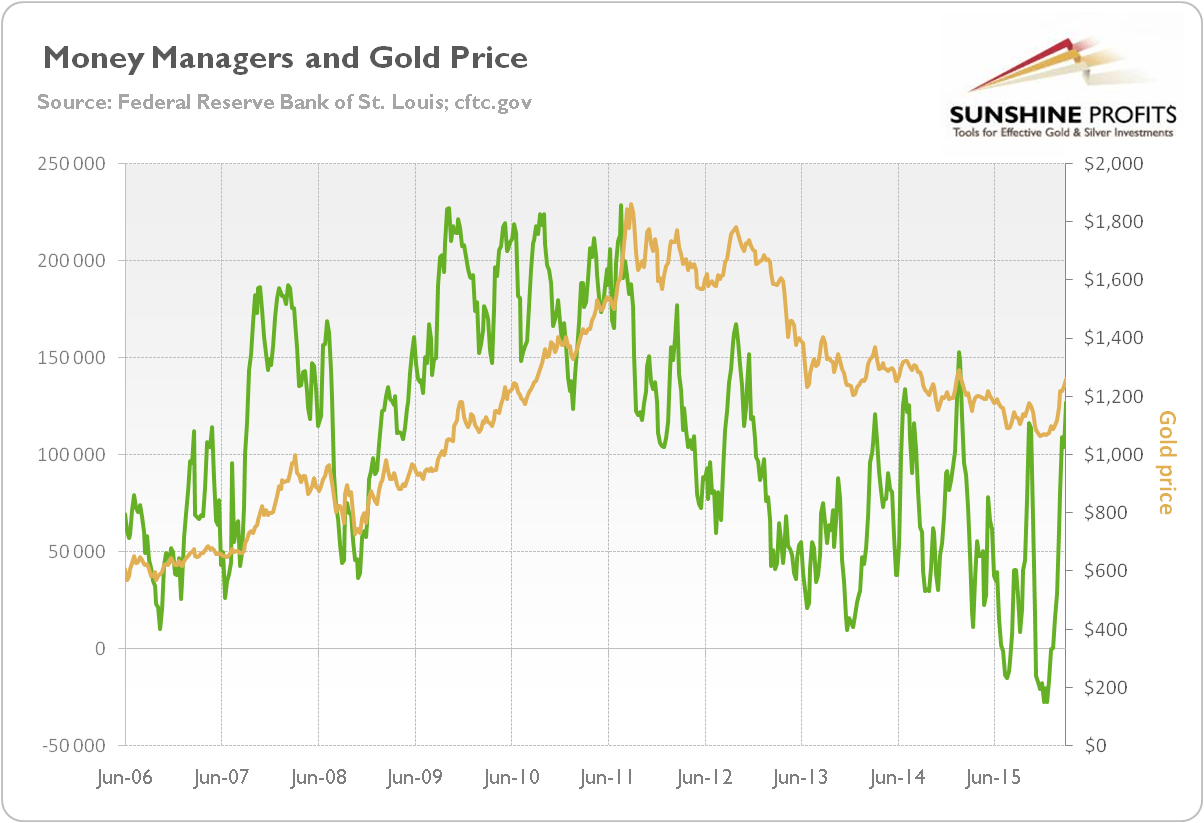
In the preceding years, money managers' net position in gold was also correlated with gold, but to a much smaller extent. Please note that their net position topped in 2009 and then refused to move to new highs while gold was making them. In 2012, it was making new lows before gold did. Overall, the positions of money managers are not as highly correlated with gold as it seems based on the last few years, and even if it were, it would not be a significant indication, let alone proof that gold price is controlled by the money managers. This is what we can say based on the charts, without even taking into account how big the gold market really is and how many other gold market participants there are.
Let's move back to the previous chart for a minute. The CoT positions are a weak technical indicator, but if one insists on using it, we can see some bearish indications on it. There were a few times when long positions in the money managers were at similar levels (red horizontal line) and all that indicated was that a bigger move lower has just begun (marked with red dashed lines). If we take the net position into account, we have a situation that's similar to two other cases (marked with red ellipses) – gold declined in both cases as well. Again, this is not a very reliable indication, but since other techniques point to much lower prices of gold, it seems that we can use it as a confirmation. The outlook remains bearish.
Want free follow-ups to the above article and details not available to 99%+ investors? Sign up to our free newsletter today!
Author

Przemyslaw Radomski, CFA
Sunshine Profits
Przemyslaw Radomski, CFA (PR) is a precious metals investor and analyst who takes advantage of the emotionality on the markets, and invites you to do the same. His company, Sunshine Profits, publishes analytical software that any


