A Luny Week On Wall Street
/definition-of-etf-21007500_XtraLarge.jpg)
Chaos Clinic for 8/8/2019
This past week the US stock market was - in a word - luny. Last week's Chaos Clinic warned that it might be so. These two charts show two views of what happened.
Luny comes from lunatic, which in turn comes from lunar. Folklore has long associated crazy behavior with the Moon. During Full Moons, patients in insane asylums were observed to be very agitated, behaving erratically. Crazy behavior in markets, especially the S&P, can be traced back to the Moon, as well. This is the basis of the MoonTides trading methodology offered on daytradingforecasts.com
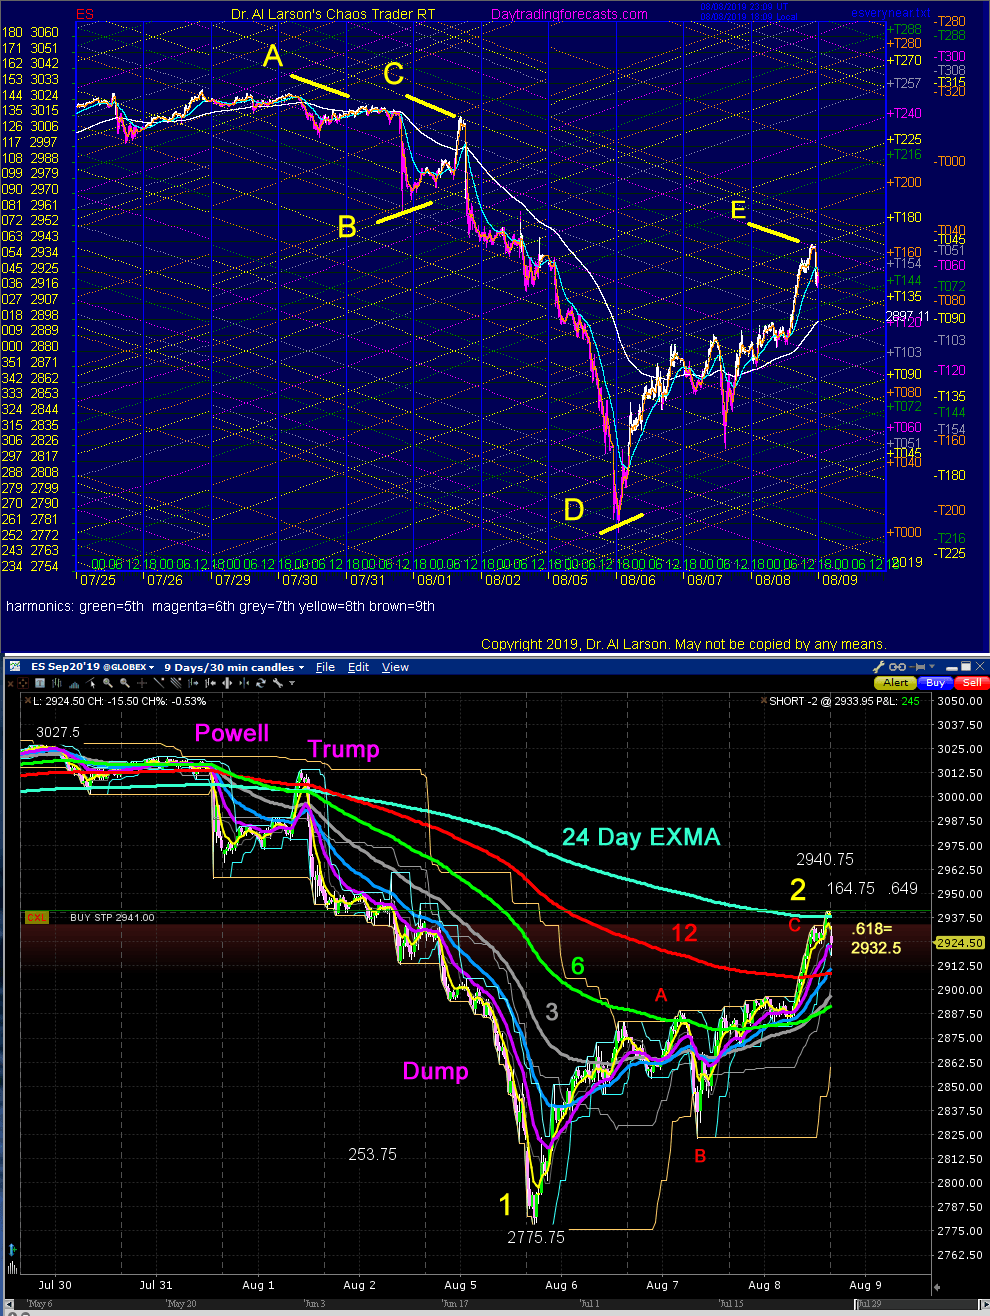
The top chart is last chart from the SPKISS page on that site. It shows the Moon electric field flux lines for various harmonics. These flux lines are support/resistance lines. Several lines are of interest on the chart. At line A, a down sloping seventh harmonic flux line triggered the FOMC drop. That drop bounced off a rising sixth harmonic line at B. Then at C, a down sixth harmonic line triggered the Trump tweet drop. Following Monday's plunge, a rising sixth harmonic flux line started a rally.
An obvious question was "How far will it rally?" The answer was in the flux lines. As it turned out a sixth harmonic down flux line at E lined up with last week's eighth harmonic line at C. The pair formed a top of channel resistance line. Pretty neat, eh? Flux line software for NinjaTrader is available at EnergyFieldTrading
The second chart shows the Powell-Trump Dump and rebound as a move 1 and 2 of a down Chaos Clamshell. From the high, the move 1 drop was 253.75 points. The move 2 rally was 164.75 points, and stalled at the 24 day EXMA. A standard Fibonacci .618 retrace was 2932.5. The retrace has the common ABC form of many corrections. One would expect selling here.
If this is indeed the end of the rebound rally, lower prices are ahead. For this to happen, the all the EXMAs shorter than the 12 day need to turn down. Next week will tell us more. A target of 2810 by the end of August remains viable.
This content was published on Dr. Al Larson's Chaos Clinic which you can attend each Friday for free.
Dr. Al Larson has developed a complete Chaos Model of Markets, four unique courses that let you become a Certified Chaos Trader, some very unique eMylar fractal pattern overlays, and tools that permit forecasting individual stocks and markets years in advance. You can also sign up for a free weekly email, and attend a free Chaos Clinic on Fridays. To learn more, click on the author's profile.
Be sure to sign up for the free weekly email!
Author

Dr. Al Larson, PhD
MoneyTide.com
Dr. Al Larson holds a Ph.D. in Electrical and Computer Engineering from the University of Wisconsin. He is a 1964 Distinguished Graduate of the U. S. Air Force Academy.


