A Basic FX Fundamental Strategy

A while ago, we talked about interest rate differentials, and defined them as the difference between the interest rate of one country vs the other. For example, we suggested that the interest rate differential between the Euro Area and the US would be 2.25% (US) minus -0.40% (Euro Area), i.e. it is 2.65%. This would imply that there is a positive carry trade potential, that is, we can gain from borrowing in Euros and depositing that money in the US.
In addition to this, we have also suggested that, in the long-run, the exchange rate would tend to strengthen on the side of the country which had the largest interest rate. To this end, a potential fundamental strategy would be to employ the movements of the bond yield to assess the potential for a change in the exchange rate.
To employ this strategy, we need three pieces of information: the exchange rate pair we want to trade and the two bond yields of the countries which comprise it. In this example, I will use the EURUSD exchange rate and thus I will have to employ the EUBUND, which is the most important bond in the Euro Area, and the US10YR bond. Bond yield data are from Thompson Reuters Eikon and the EURUSD rate from the MT4 platform, all at a daily frequency, with a sample from January to October 2018.
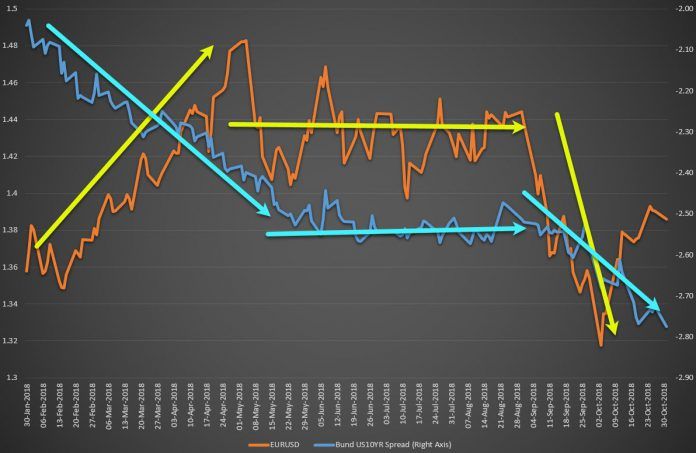
So what we need to do is compare the two bonds yields. Given that the exchange rate is defined as EURUSD, we calculate the Spread by deducting the US10YR from the EUBUND, which should lead to a negative number, as the blue line in the graph at the top of this post suggests, while the EURUSD pair is illustrated as the orange line. The arrows in the graph provide a simple overview of the broad movements in the Spread and the currency pair.
As the graph suggests, there is a positive relationship between the two, with the Euro depreciating as the Spread between the two countries became more negative until the first half of the year. Then, as the Spread was more or less stable over the summer, the exchange rate moved more or less sideways. Finally, as the downwards move began in early September we can also observe a further depreciation of the EURUSD exchange rate.
Naturally, the Spread does not offer a full-proof strategy for all exchange rate movements, as obvious from the graph. There are also many other events, either short- or longer-lived, which have different effects on the bond yield and the exchange rate. These can also be important events such as NFPs, GDP, the trade balance and various others.
Still, the long-run relationship between the two variables is there, and can also be confirmed via econometric testing, such as the Engle-Granger co-integration test. For interested readers, co-integration simply means that two variables tend to move together in the long run. This long-run notion should not be interpreted that it refers to some abstract date far from today; in contrast, it should be interpreted as the reaction we should expect in the absence of any factors which could cause a non-permanent fluctuation. In other words, if no politics and no sentiment participated in the markets then what we would have observed is that every time we saw a decrease in the Spread the Euro would have depreciated.
We left the most interesting part for the end On the rightmost part of the graph we can see that the Spread decreased although there was no notable reaction in the exchange rate thus far. This could only mean one of two things: the first is that the reaction is mostly related to the recent data announcement which showed a bleaker than expected US macroeconomic outlook, or that this is just due to some other, transitory factors, and hence the Spread will be reduced in the coming days. The only way traders can understand which of the two is more likely to hold is by keeping a close watch on the coming US and EU macroeconomic developments.
Author

With more than 4 years of experience at the Central Bank of Cyprus where he obtained hands-on experience with real-life economics, Dr Nektarios Michail is a supporter of a balanced approach between science and art when it comes to


