10th July is a major pivot point

July Update – Technically, the S&P has made a higher low and a lower high and is now about in the middle of that range. Astrologically, the picture looks much simpler this month, compared to the past several months. This month we have a strong trend indication until 7/10 AC. Then, that weekend, Mercury will turn Direct and that is a Planetary Polarity Point which could reverse the first week’s trend. That should be the major pivot point for the month. If the market reverses by Monday, 7/13, there is a good chance that the trend will have been reversed for the rest of the month. However, if the trend continues in the same direction past 7/13, there is a good chance the market will continue to trend in that direction for the rest of July.
Market Math – 7/08 = 28,561 days (169^2) from the 4/28/1042 major low. 7/16 = 19,881 days (141^2) from the 2/09/1966 major high.
Fibonacci – 7/10, 7/13, 7/20, 7/22, 8/1
Astro – 7/6, 7/13, 7/20, 7/27, 7/31 AC
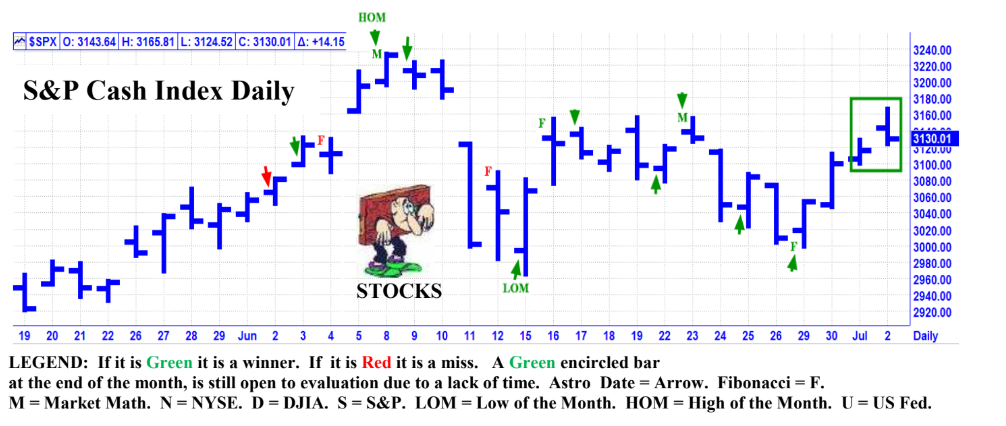
June Review
This month looks like it could be another huge month with many major planetary events. Following is a list of the best of the best.
5//29 AC – Neptune Parallel US Moon.
6/03 AC – Helio Jupiter Parallel Pluto.
6/05 PM – Venus 0 South Latitude.
6/05 PM – Lunar Eclipse.
6/12 PM – Mercury 0 South Latitude.
6/12 AC – Pluto 180 US Mercury.
6/17 AC – Mercury Retrograde.
6/18 AC – Solar Eclipse.
6/22 AC – Neptune Retrograde.
6/24 AC – Venus Direct.
6/29 AC – Geo Jupiter 0 Pluto.
7/02 AC – Lunar Eclipse.
WOW! Sorry, but I tried to reduce the list to only the very top ones and that is the best I could do. With so many change in trend points, it is impossible to forecast any steady trend for the month. The most likely scenario is a very whippy month.
Results
Market Math:
6/8 = 4,624 days (68^2) from the 10/11/2007 major top.
6/8 was the exact high of the month.
6/23 = 7,396 days (86^2) from the 3/24/2000 major dot com bubble top.
6/23 was a very good short term high.
7/1 = 16,641 days (129^2) from the 12/09/1974 low.
7/1 is too soon and is still open to evaluation.
Score – 2 out of 2 good dates = 100%.
Fibonacci – 6/4, 6/12, 6/16, 6/28 6/4 and 6/12 were not effective. 6/16 was a good short term high. 6/28 was a Sunday = 6/29 was a very good low.
Score – 2 out of 4 good dates = 50%.
Astro – 6/1, 6/2, 6/3, *6/8*, 6/9, 6/15, 6/17, 6/22, 6/23, 6/25, 6/29, 7/2 AC
6/1 was not effective. 6/3 was a one day high. 6/8 was the exact high of the month. 6/9 was close in price and one
day past the 6/8 high of the month. 6/15 was the low of the month. 6/17 was close in price and one day past the
6/16 high. 6/22 was a good short term low. 6/23 was a very good short term high. 6/25 was a one day low. 6/29
was a very good low. Score – 9 out of 11 good dates = 81.82%.
Total Score – 13 out of 16 good dates = 76.47%
Author

Norm Winski
Independent Analyst
www.astro-trend.com


