$YM_F Dow Futures Reacting Higher After Double Correction Lower
This technical blog will look at the past performance of the 4-hour Elliott Wave Charts of Dow futures ticker symbol: $YM_F. We presented to members at the elliottwave-forecast. The rally from the 03 October 2022 low unfolded as an impulse structure and showed a bullish sequence. The index should see more upside extension to complete the impulse sequence. Therefore, we advised members not to sell the index & buy the dips in 3, 7, or 11 swings at the blue box areas. We will explain the structure & forecast below:
Dow Futures 4-Hour Elliott Wave Chart From 4.17.2024
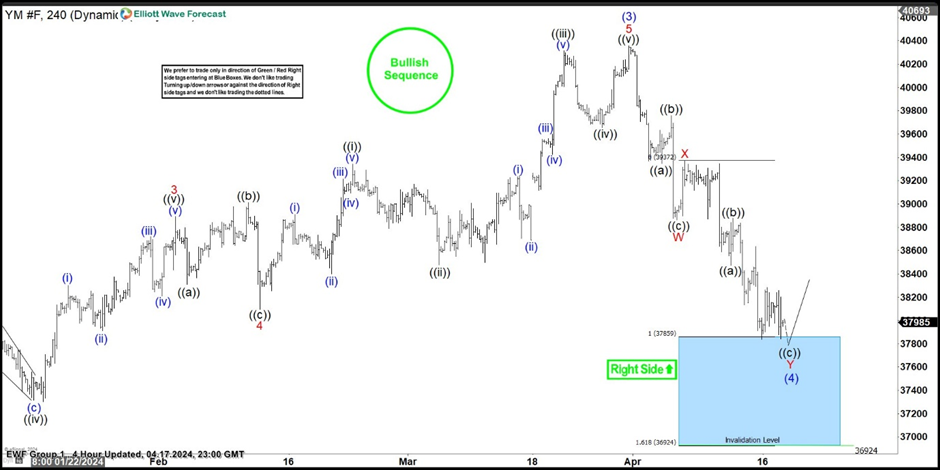
Here’s the 4-hour Elliott wave chart from the 4/17/2024 update. In which, the cycle from the 10/27/2023 low ended in wave (3) as impulse at $40358 high. Down from there, the index made a pullback in wave (4) to correct that cycle. The internals of that pullback unfolded as Elliott wave double three structure where wave W ended at $38864 low. Wave X bounce ended at $39369 high and wave Y managed to reach the blue box area at $37859- $36924. From there, buyers were expected to appear looking for the next leg higher or for a 3 wave bounce minimum.
Dow Futures Latest 4-Hour Elliott Wave Chart From 4.22.2024
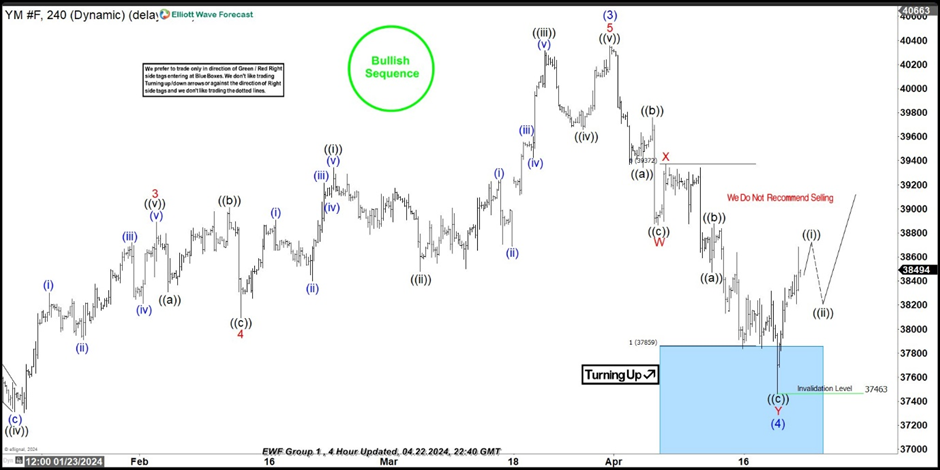
This is the latest 4-hour Elliott wave Chart from the 4/22/2024 update. In which the index is showing a reaction higher taking place, right after ending the double correction within the blue box area. Allowed members to create a risk-free position shortly after taking the long position at the blue box area. However, a break above $40358 high is still needed to confirm the next extension higher towards $41041- $42147 area higher and avoid double correction lower.
Author

Elliott Wave Forecast Team
ElliottWave-Forecast.com


