|

WTI steady amid global rate decisions, poised for a weekly gain

  • WTI crude oil is up by 0.28%, supported by PBoC’s rate cut.
  • ECB’s rate hike and Fed’s rate hold contrast, influencing WTI’s movement.
  • Increasing Chinese oil demand, OPEC+ output cuts lend support to WTI prices.

Western Texas Intermediate (WTI), the US crude oil benchmark, remained steady on Friday, gaining 0.28% or $0.50, set for weekly gains of more than 1%. The rate cut provided by the People’s Bank of China (PBoC) aimed to stimulate economic growth and improve oil’s outlook. At the time of writing, WTI exchanged hands at $70.75, up 0.21%.

China’s rate cut and OPEC+ output cut to prop up oil amid economic headwinds

Major global central banks decided to hold rates unchanged amidst worldwide elevated prices and an ongoing economic slowdown. The European Central Bank (ECB) raised rates to a 22-year high, while the Federal Reserve (Fed) “skipped” June’s meeting, though upward revised its peak rates to finish above the 5.50% threshold. Even though bolstered the greenback, Jerome Powell’s neutral commentary erased those gains, which weighed on WTI-s price.

Contrarily to the ECB and the Fed, the PBoC slashed rates after the Chinese economy failed to recover faster than expected, as recent data points to a loss In momentum. That capped oil prices rise after Saudi Arabia announced a cut on its crude oil output to begin in July.

Oil prices were underpinned by increasing demand in China, as its refinery output grew to its second-highest reading on record. Kuwait Petroleum Corp CEO estimates Chinese oil demand will increase towards the second half.

It is worth mentioning that voluntary crude output cuts implemented by the Organization of the Petroleum Exporting Countries and its allies (OPEC+) will curb supply in the near term. That, alongside a weaker US Dollar (USD), after the Fed-s hold rates unchanged, are tailwinds for WTI prices.

WTI Price Analysis: Technical outlook
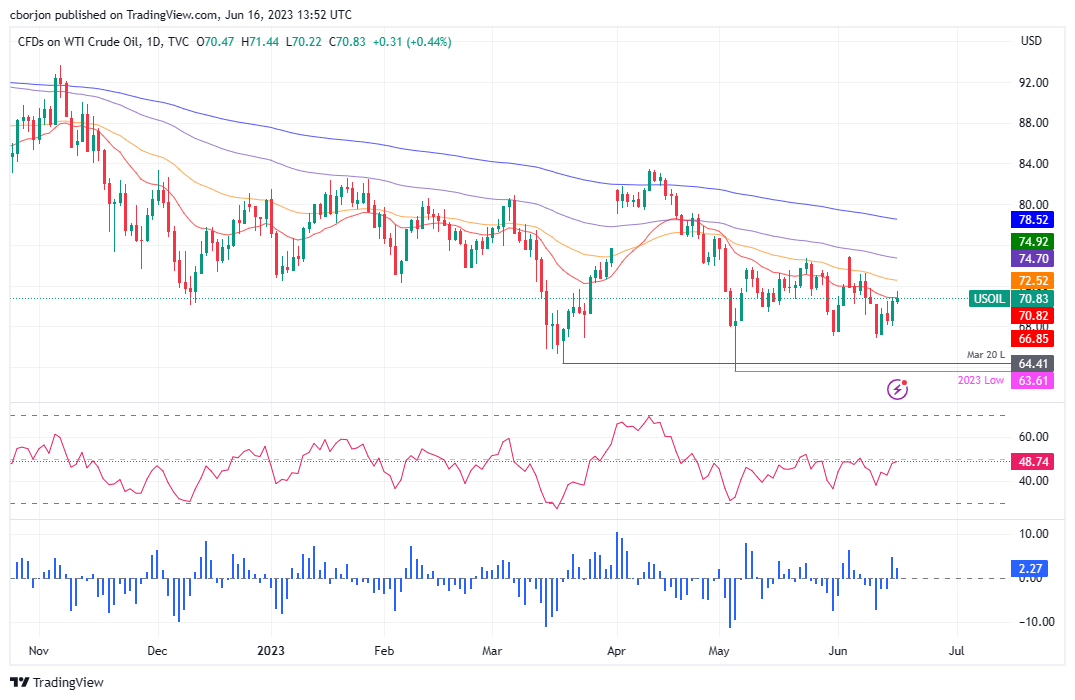
WTI Daily chart

From a technical perspective, WTI remains sideways after bottoming at around the $63.50/$68.00 area in the year. Even though technical indicators and price action suggest further downside, WTI is forming a double bottom that could propel prices to test the 200-day Exponential Moving Average (EMA) at $78.52. On the upside, WTI’s first resistance would be the 50-day EMA at $72.51, followed by the 100-day EMA at $74.70m, and then the 200-day EMA. On the downside, a fall below $66.85 would pave the way to challenge the YTD low at $63.61.

WTI US OIL

Overview
Today last price70.74
Today Daily Change-0.04
Today Daily Change %-0.06
Today daily open70.78
 
Trends
Daily SMA2071.15
Daily SMA5073.85
Daily SMA10074.8
Daily SMA20078.24
 
Levels
Previous Daily High71.16
Previous Daily Low68.15
Previous Weekly High74.36
Previous Weekly Low69.17
Previous Monthly High76.61
Previous Monthly Low64.31
Daily Fibonacci 38.2%70.01
Daily Fibonacci 61.8%69.3
Daily Pivot Point S168.9
Daily Pivot Point S267.02
Daily Pivot Point S365.9
Daily Pivot Point R171.9
Daily Pivot Point R273.03
Daily Pivot Point R374.91

Author

Christian Borjon Valencia

Markets analyst, news editor, and trading instructor with over 14 years of experience across FX, commodities, US equity indices, and global macro markets.


More from Christian Borjon Valencia
Share:

Editor's Picks

AUD/USD remains below 0.7000 amid light trading

AUD/USD fills a modest bearish gap on Monday, but remains below 0.7000 in the Asian session amid holiday-thinned liquidity. The US Dollar attempts a bounce even as US bond yields pull back from multi-year highs, limiting the pair. Moreover, diminishing odds of another RBA rate hike in November cap the Aussie.

USD/JPY hovers above 158.00 amid Japan/ US holiday

USD/JPY extends its range-bound price action into a new week, trading above 158.00 as bulls remain on high alert amid speculation that authorities will step in to prop up the Japanese Yen. Meanwhile, softer US bond yields keep US Dollar bulls on the back foot and cap the pair's upside. However, geopolitical uncertainties could limit losses for the safe-haven buck amid thin liquidity due to a holiday in Japan and the US.

Gold sticks to modest losses; seems vulnerable below $4,200 on Fed hike bets

Gold extends its intraday retracement slide from a one-week high, hitting a fresh daily low around $4,170 during the early European session. The US Dollar attracts fresh buyers after a modest downtick amid the US Federal Reserve's hawkish outlook, which, in turn, is seen as weighing on the non-yielding bullion.

Pi Network Price Forecast: PI defends $0.0800 support as selling pressure mounts

Pi Network is trading in the red on Monday, hovering above $0.0800 as selling pressure mounts. PI token’s speculative demand is easing, with Open Interest below $9 million despite rising social chatter, hinting at panic-driven buzz among investors. The technical outlook for PI suggests a bearish bias, with the risk of breaking below the $0.0800 support level.

USD/INR: Deep in red below 96.00 as RBI rescues Indian Rupee

After opening significantly higher against the US Dollar (USD) on Monday, the Indian Rupee (INR) clings to recovery gains near 95.80. The pair remains undermined by the Reserve Bank of India’s (RBI) fresh measures to curb US Dollar demand, which has brought relief for the Indian currency.

Has Bitcoin really escaped the macro forces it was built to fight?
Over 17 years ago, Satoshi Nakamoto designed Bitcoin (BTC) on the back of a global financial crisis as an alternative to the global monetary system outside the control of central banks, governments and traditional intermediaries. This raises a key question: has Bitcoin really become independent of the macroeconomic forces it was built to challenge?















