|

WTI rallies for the third day, eyeing a close above 2017 high around $112.20

  • Western Texas Intermediate (WTI) continues rallying, gaining so far in the week 21.16%.
  • Ukraine-Russia woes would keep WTI traders on their toes as market sentiment worsens, oil rises.
  • WTI Price Forecast: Bullish but subject to a mean reversion move if geopolitical tensions ease.

US crude oil benchmark, also known as WTI, rallies 4.67% in the day, aiming to close above the $100 mark for the second day of the year as Wall Street closed, with US equities printing gains. The market sentiment is upbeat, though it would be subject to Ukraine-Russia tussles as it happened in the last two weeks. WTI probes August 2013 $112.21 highs at press time, trading at $111.38 per barrel.

OPEC+ kept the crude oil output unchanged

On Wednesday, the Organization of the Petroleum Exporting Countries and its allies, also known as OPEC+, decided to continue the increase of 400,000 of its crude oil output, as reported by the statement. In the statement, OPEC+ said that current fundamentals and the outlook for the future pointed “to a well-balanced market.” Furthermore, the cartel noted that “volatility” and “geopolitical developments” are to be blamed if demand for the black gold increments.

“Such an argument will increasingly strain credulity,” said analysts quoted by the New York Times.

Market’s reaction

Once the statement crossed wires, Brent crude approached $114.00 a barrel, while WTI hit $112.50, a 10-year high.

Additional factors that would keep oil prices high are sanctions on Russia. Bloomberg reported that “Russia’s flagship Urals crude oil was offered for sale at a record discount but got no bidders, the latest indication that oil trading from the country’s western ports is grinding to a halt.”

Therefore, in the near term, oil traders beware of geopolitical news, while fundamental news would remain in the backseat at the moment.

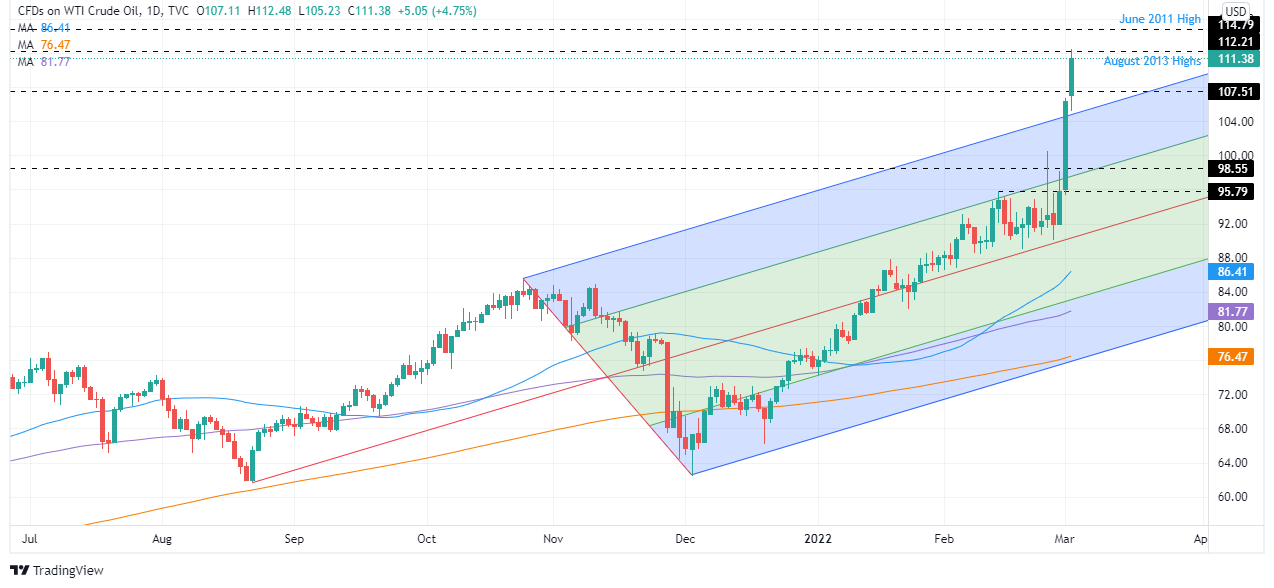
WTI Price Forecast: Technical Outlook

Western Texas Intermediate (WTI) upward move stalled at August 2017 high at $112.21. However, US crude oil’s steeper rise means that the black-gold would be subject to a mean reversion move, a likely scenario, due to the $15.00 move to YTD highs at $112.50.

If that scenario plays out, WTI’s first support would be March 1 high at 106.75. Breach of the latter would expose the $100 mark, followed by August 2014 swing high at $98.55.

Contrarily, if WTI keeps surging, the first resistance would be $112.50. Once cleared, the next resistance would be June 2011 monthly high at $114.79.

WTI US OIL

Overview
Today last price109.79
Today Daily Change6.33
Today Daily Change %6.12
Today daily open103.46
 
Trends
Daily SMA2091.4
Daily SMA5084.94
Daily SMA10080.8
Daily SMA20075.88
 
Levels
Previous Daily High105.19
Previous Daily Low94.49
Previous Weekly High100
Previous Weekly Low88.93
Previous Monthly High100
Previous Monthly Low85.74
Daily Fibonacci 38.2%101.1
Daily Fibonacci 61.8%98.57
Daily Pivot Point S196.9
Daily Pivot Point S290.34
Daily Pivot Point S386.19
Daily Pivot Point R1107.6
Daily Pivot Point R2111.75
Daily Pivot Point R3118.31

Author

Christian Borjon Valencia

Markets analyst, news editor, and trading instructor with over 14 years of experience across FX, commodities, US equity indices, and global macro markets.

More from Christian Borjon Valencia
Share:

Editor's Picks

AUD/USD regains mild traction, falters near 0.7150

AUD/USD gathers some steam and manages to flirt with the 0.7150 level on Thursday. However, the pair has retraced some of Wednesday’s significant pullback due to renewed selling pressure on the Greenback and a slight improvement in risk sentiment following hopes of a deal in the Middle East. Wrapping up the Australian docket, the RBA’s Hauser will speak early on Friday.

USD/JPY: Japanese Yen coiled at the line, leaning on everyone but Japan

The Yen is doing very little, and that stasis is the whole story. USD/JPY sits glued near 160.00 not because Japan has found new strength, but because two outside forces are fighting to a draw over it: a US rate complex that keeps the dollar bid, and a Ministry of Finance that refuses to let the line break.

Gold puts its 200-day SMA to the test near $4,420

Gold keeps the bullish stance in place in the latter part of Thursday’s session, although a convincing break above the key $4,500 mark per troy ounce still remains elusive. The precious metal’s advance comes amid the resurgence of some selling interest around the Greenback, improving risk sentiment, and declining US Treasury yields across the board.

Bitcoin falls below $64K as demand turns negative, short-term holders' selling intensifies

Bitcoin has fallen below $64,000 on Thursday amid weakening market demand and mounting selling pressure from short-term holders. The leading cryptocurrency slipped toward the $63,000 level amid a broader risk-off environment, with several key metrics signaling one of the most challenging periods of the current market cycle.

Nonfarm payrolls: Testing the limits of Fed policy patience

The upcoming nonfarm payrolls report for May will provide the final update on the US labor market before Kevin Warsh attends his first policy meeting as the new Fed Chair later this month.

Recession on paper: What really moves the Canadian Loonie now?

Statistics Canada handed the headline writers a gift and the analysts a headache. Real GDP shrank 0.1% on an annualized basis in the first quarter, and with the fourth quarter of 2025 revised down to a 1.0% contraction, that is two negative quarters in a row, the textbook definition of a technical recession and Canada's first since the pandemic.