WTI prints fresh lows within bearish daily structure
- WTI prices are falling to fresh lows into the closing bell.
- Bears are positioning for an OPEC deal and additional supply.

Oil prices are falling on Thursday and extending Wednesday's decline on talk of an OPEC+ accord.
At the time of writing, WTI is down by over 1.8% and by more than $1 a barrel. WTI has fallen from a high of $72.93 to a low of $71.44.
The back gold is suffering from the expectations of more crude oil coming on line hitting after a compromise deal between leading OPEC producers and a surprisingly poor weekly reading on US fuel demand.
Reuters reported on Wednesday that Saudi Arabia and the United Arab Emirates had reached an accord that should pave the way for a deal to supply more crude to a tight oil market.
A deal has yet to be solidified, Reuters reported, and the UAE energy ministry said deliberations are continuing.
Additionally, the US dollar edged higher on Thursday, recovering some of the ground lost in the prior session following Federal Reserve's chairman, Jerome Powell, told Congress that he sees no need to rush the shift towards tighter post-pandemic monetary policy.
DXY, which measures the greenback against a basket of six currencies, has climbed in recent weeks as investors got more sanguine about the outlook for the greenback.
By the close today, DXY was 0.2% higher at 92.571. The index fell as low as 92.272 earlier in the session but has printed a high of 92.694 so far.
The highs this year have been driven by an increasingly upbeat assessment of the US economy by the Federal Reserve, which has brought forward the time frame on when it will next raise rates.
This casts a bearish fundamental backdrop to the following technicals.
WTI technical analysis
The price of WTI has formed a bearish structure on the daily chart considering the lower daily highs for this month.
With that being said, a bullish case can also be made and the following illustrates both bias and their subsequent market structures.
Daily chart, WTI
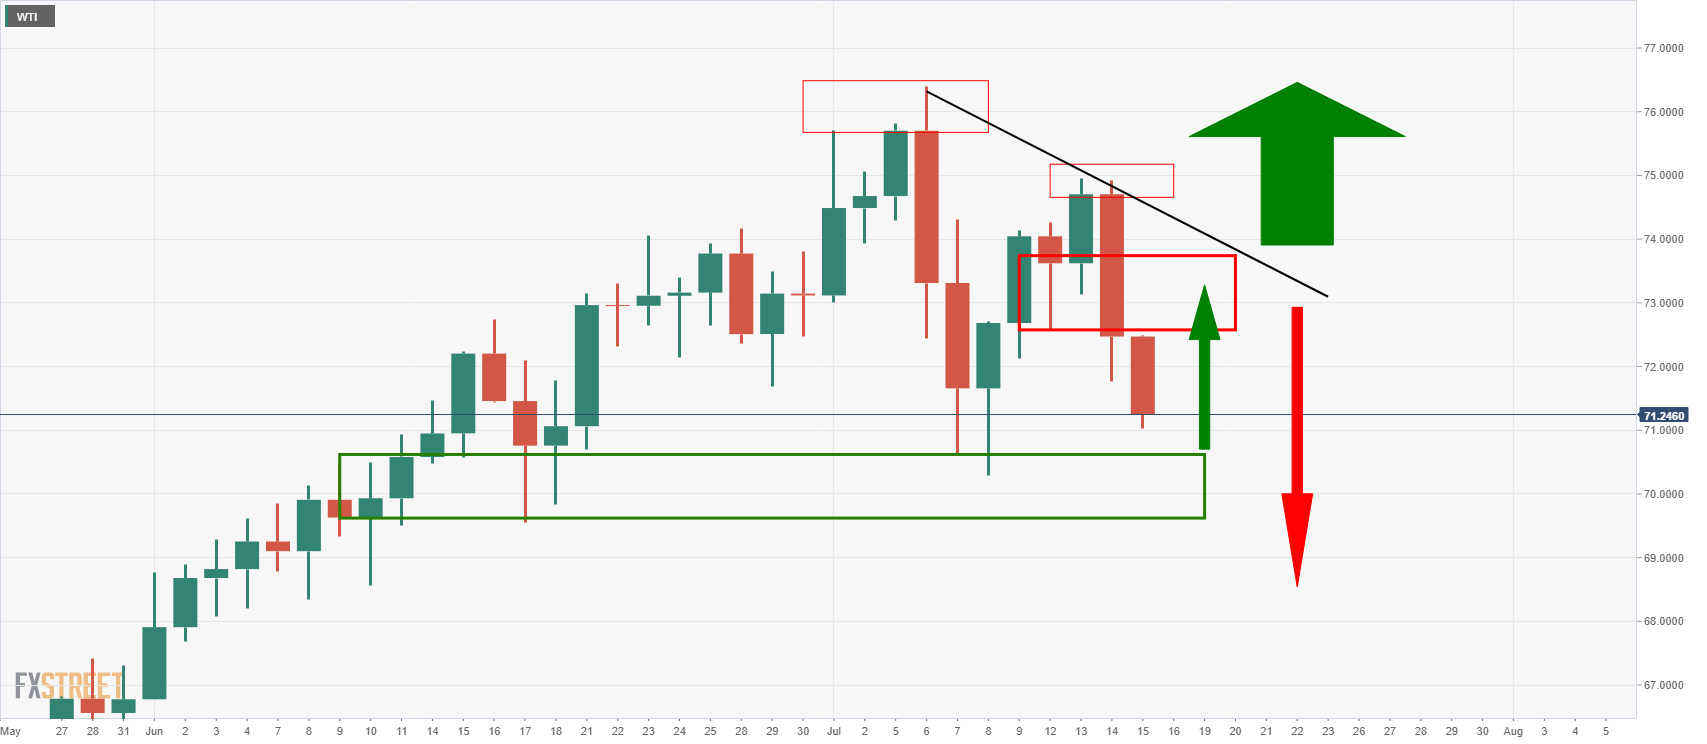
The above chart illustrates the lower highs, dynamic trendline resistance, immediate horizontal daily resistance and support areas.
Bullish scenario
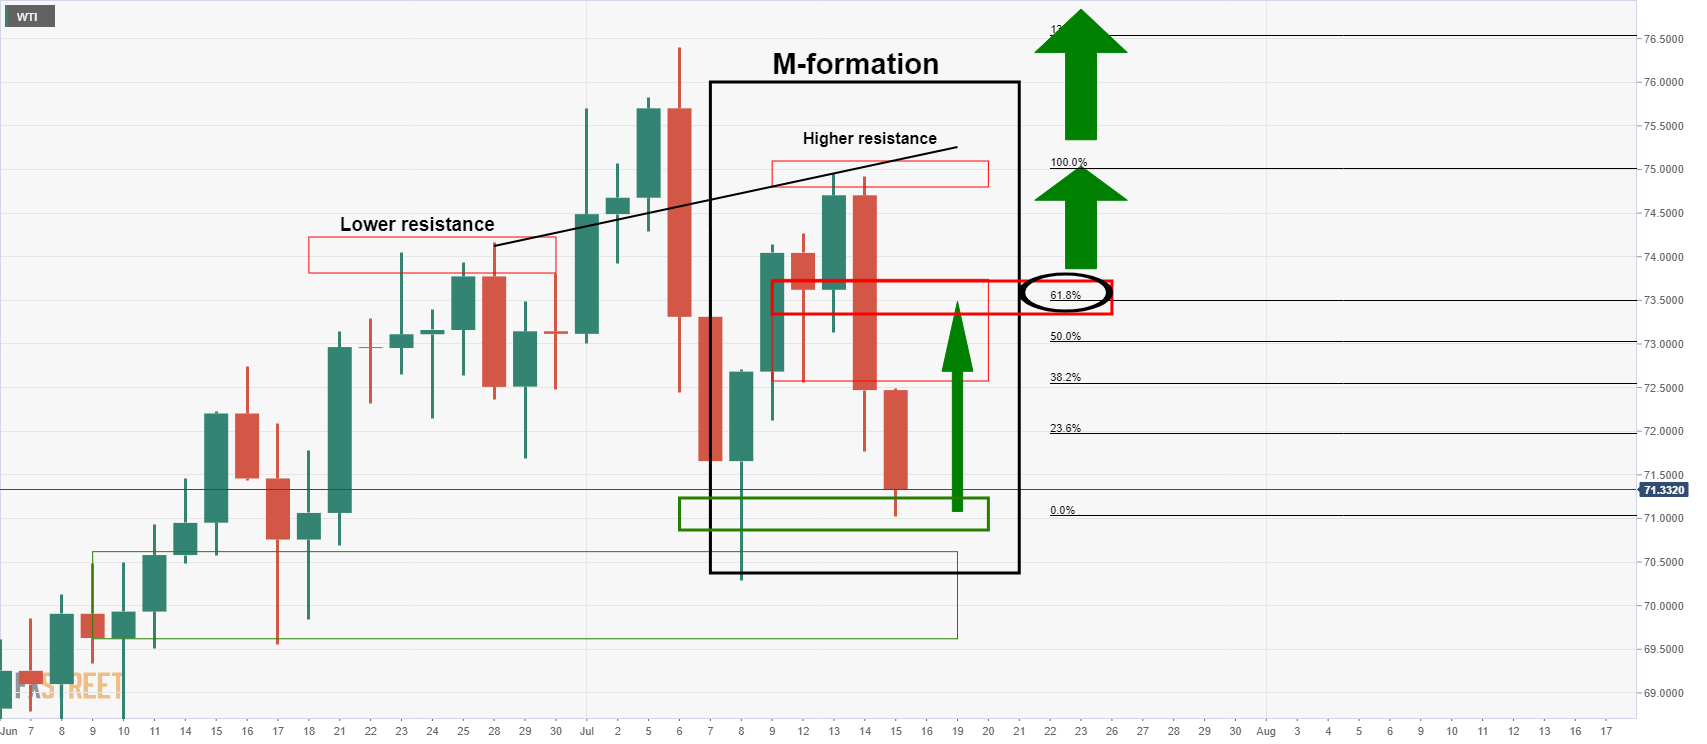
Given the higher resistance in the latest daily highs at 74.95 compared to the late June highs of 74.16, combined with the M-formation, there is a risk of a break of the cycle highs of 76.40.
The M-formation's neckline has a confluence with the 61.8% Fibonacci around 73.50/60, If this is broken, the bulls will be back in control.
Bearish scenario
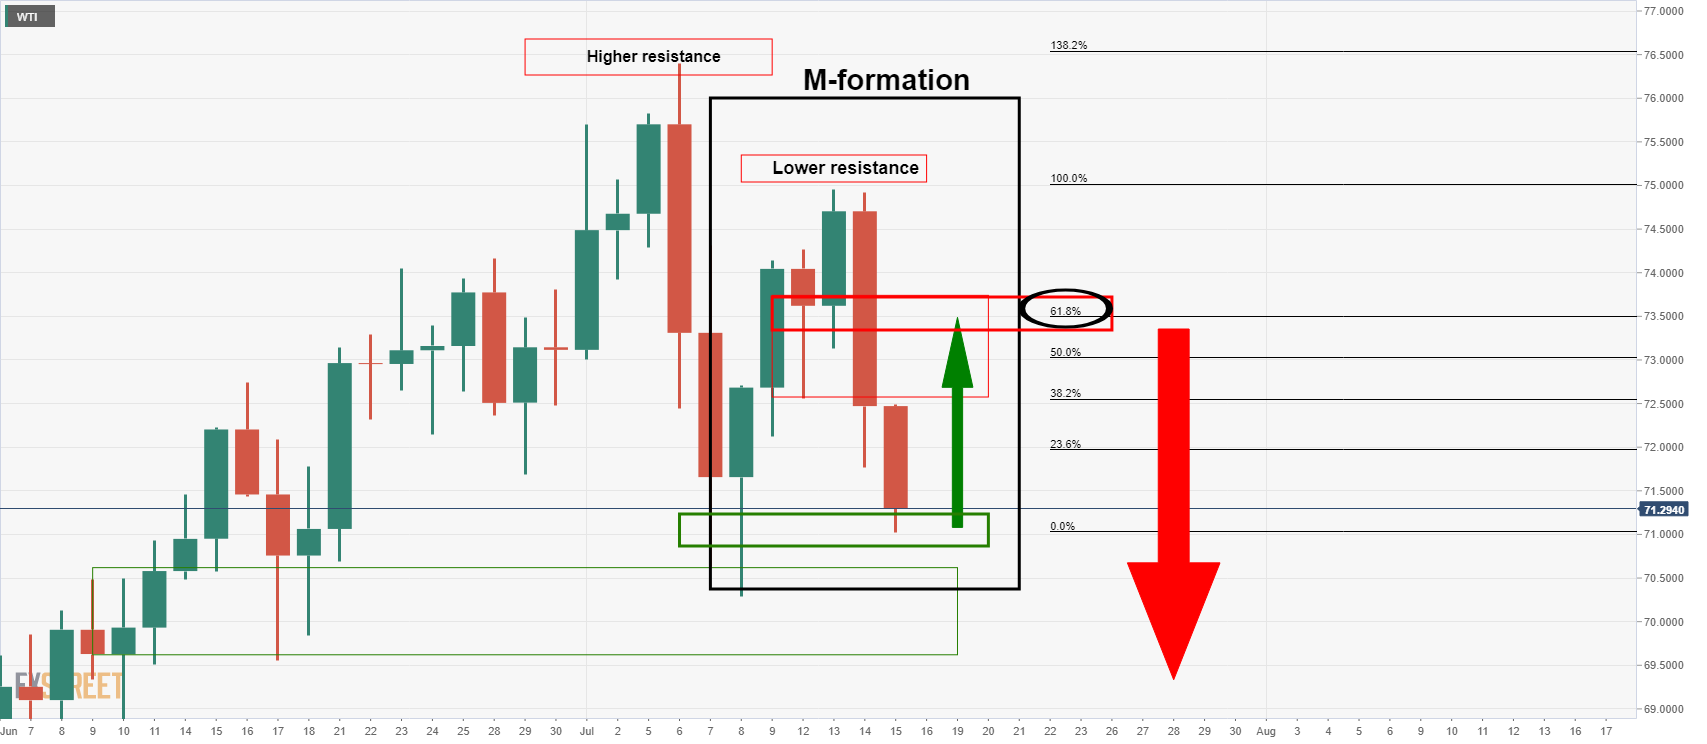
The bearish scenario takes into account the lower highs of late combined with the neckline and confluence of the 61.8% Fibonacci that would be expected to act as a firm resistance on a retest.
Combine that with what could be argued to be a bearish head & shoulders ...
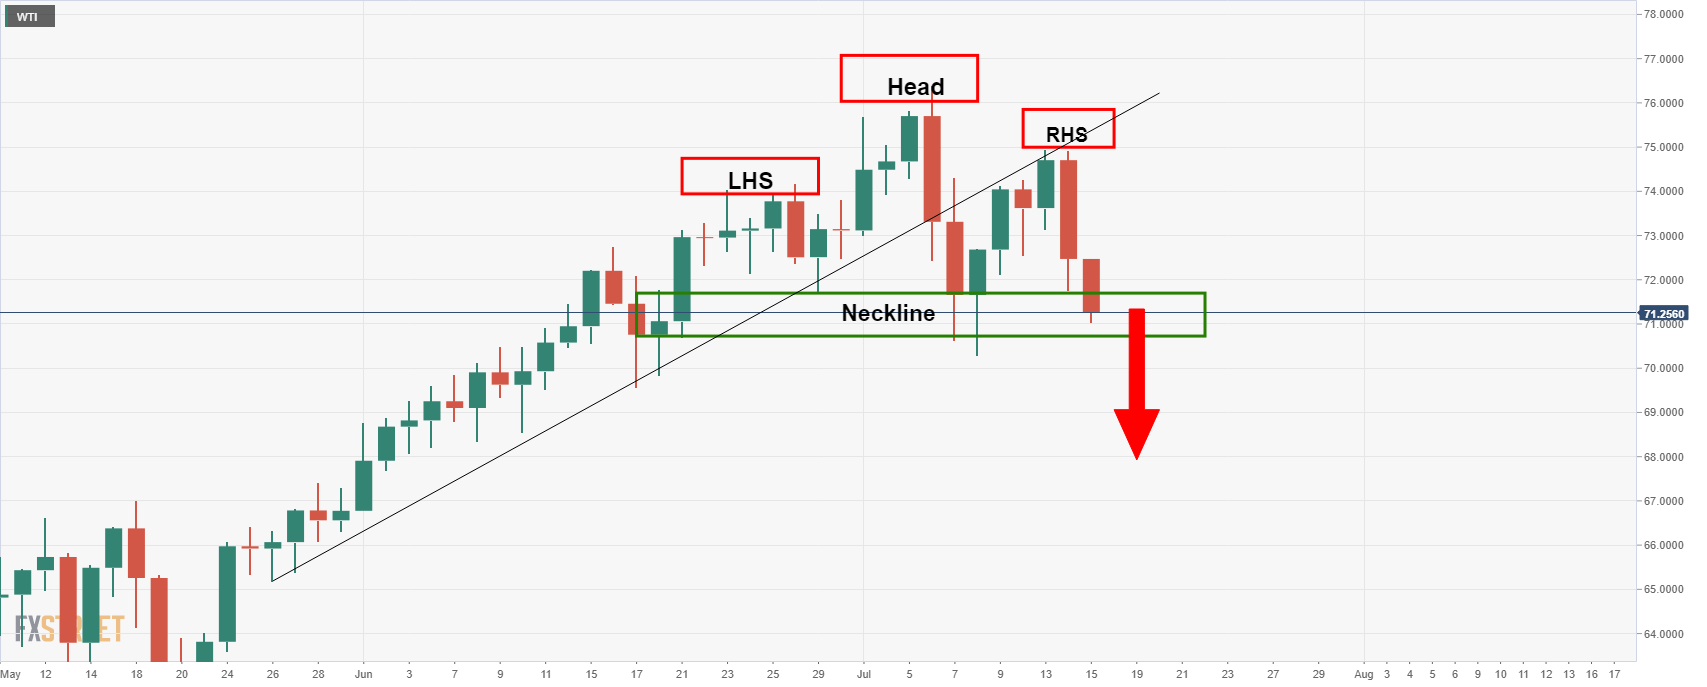
... bears can be on the lookout for bearish structure following a restest of the M-formation resistance area between 73.20 and 74.10.
With that being said, there is no guarantee that the neckline of the M-formation will be retested.
There are equal probabilities that the price will continue to melt deepening into the support area in the closing sessions for the week.
Author

Ross J Burland
FXStreet
Ross J Burland, born in England, UK, is a sportsman at heart. He played Rugby and Judo for his county, Kent and the South East of England Rugby team.


