WTI Price Forecast: WTI Crude Oil holds gains above $62, momentum builds for further upside
- WTI trades around $62.80 on Thursday, up 1.20% but below the session high of $63.30.
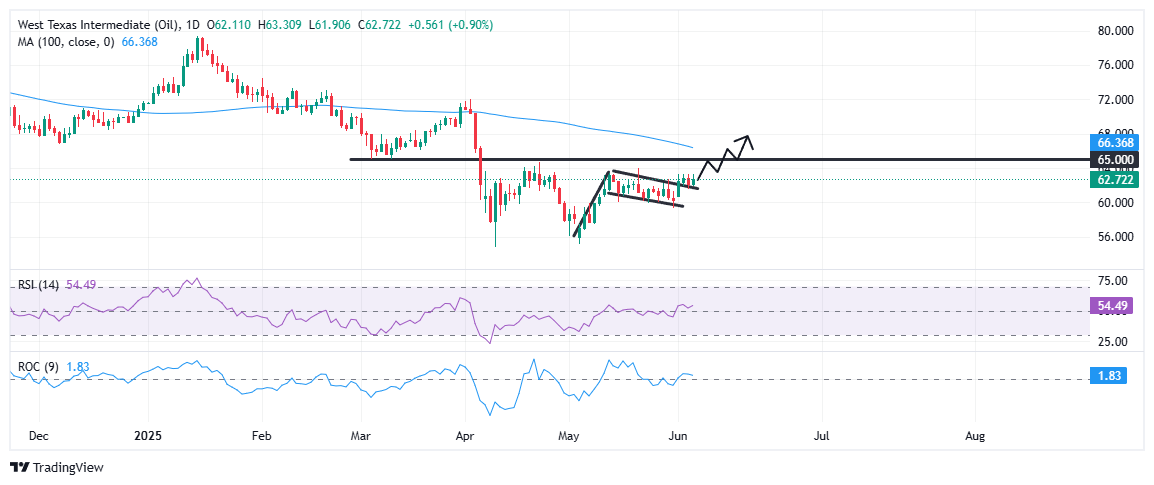
- Price action breaks out of bullish flag pattern, confirming short-term upside bias.
- Immediate resistance seen at $63.00–$63.50; sustained break could target $65.00 and $66.37 (100-day SMA).
- Support rests at $62.00; a break below may drag prices back to $60.00.

West Texas Intermediate (WTI) crude oil extends its recovery on Thursday, building on early week gains as bulls capitalize on a bullish flag breakout. At the time of writing, WTI is trading around $62.80, up nearly 1.20% on the day, and slightly below the intraday high of $63.30. The recent price action reflects a healthy consolidation phase following Monday’s sharp 3% rally, suggesting that the upward momentum remains intact as traders eye key resistance levels ahead.
From a technical standpoint, the recent breakout from a bullish flag formation adds weight to the ongoing upside bias. This continuation setup emerged after Monday’s strong rally and was followed by a modest, downward-sloping pullback — a typical sign of profit-taking within an uptrend.
The breakout has so far held above the $62.00 level, but bulls now face a near-term test at the $63.00–$63.50 resistance zone. This range, just shy of the week’s high, has acted as a short-term cap and needs to be cleared decisively to confirm bullish control and open the path toward the $65.00 psychological barrier, which has capped gains since mid-April. Furthermore, the 100-day Simple Moving Average (SMA) at $66.37 serves as the next major technical target.
On the downside, if WTI fails to hold above $62.00, prices could fall back into the flag pattern, with key support near the $60.00 round figure at the lower end of the channel. A break below that would weaken the bullish outlook.
Momentum indicators continue to support the upside setup. The 14-day Relative Strength Index (RSI) is gradually rising and currently stands at 54.49 — comfortably above the neutral 50 mark, indicating bullish momentum without flashing overbought conditions. The Rate of Change (ROC) indicator also holds in positive territory, signaling persistent upward pressure. As long as the price holds above $62.00, the bullish breakout remains valid. However, a sustained drop below this threshold would raise the risk of a false breakout, potentially shifting the short-term bias back in favor of consolidation or a deeper pullback.
Author

Vishal Chaturvedi
FXStreet
I am a macro-focused research analyst with over four years of experience covering forex and commodities market. I enjoy breaking down complex economic trends and turning them into clear, actionable insights that help traders stay ahead of the curve.


