WTI Price Forecast: Sticks to modest recovery gains above $69.00, not out of the woods yet
- WTI attracts some buyers on Thursday, albeit it lacks follow-through.
- Demand concerns overshadow hopes for OPEC+ output hike delay.
- The technical setup still seems tilted firmly in favor of bearish traders.

West Texas Intermediate (WTI) US crude Oil prices trade with a mild positive bias, just above the $69.00/barrel mark during the early European session on Thursday, albeit lack bullish conviction. The commodity remains well within the striking distance of the YTD low, around the $68.45 region touched the previous day and seems vulnerable to prolonging its downtrend witnessed over the past two months or so.
Reports that OPEC+ is discussing delaying its oil output increase scheduled to start in October turn out to be a key factor lending some support to Crude Oil prices. Apart from this, a subdued US Dollar (USD) demand further benefits the USD-denominated commodity. That said, persistent demand worries in China – the world's largest oil importer – and renewed fears about an economic downturn in the US act as a headwind for the commodity. This, along with a bearish technical setup, warrants some caution before confirming that the black liquid has formed a near-term bottom.
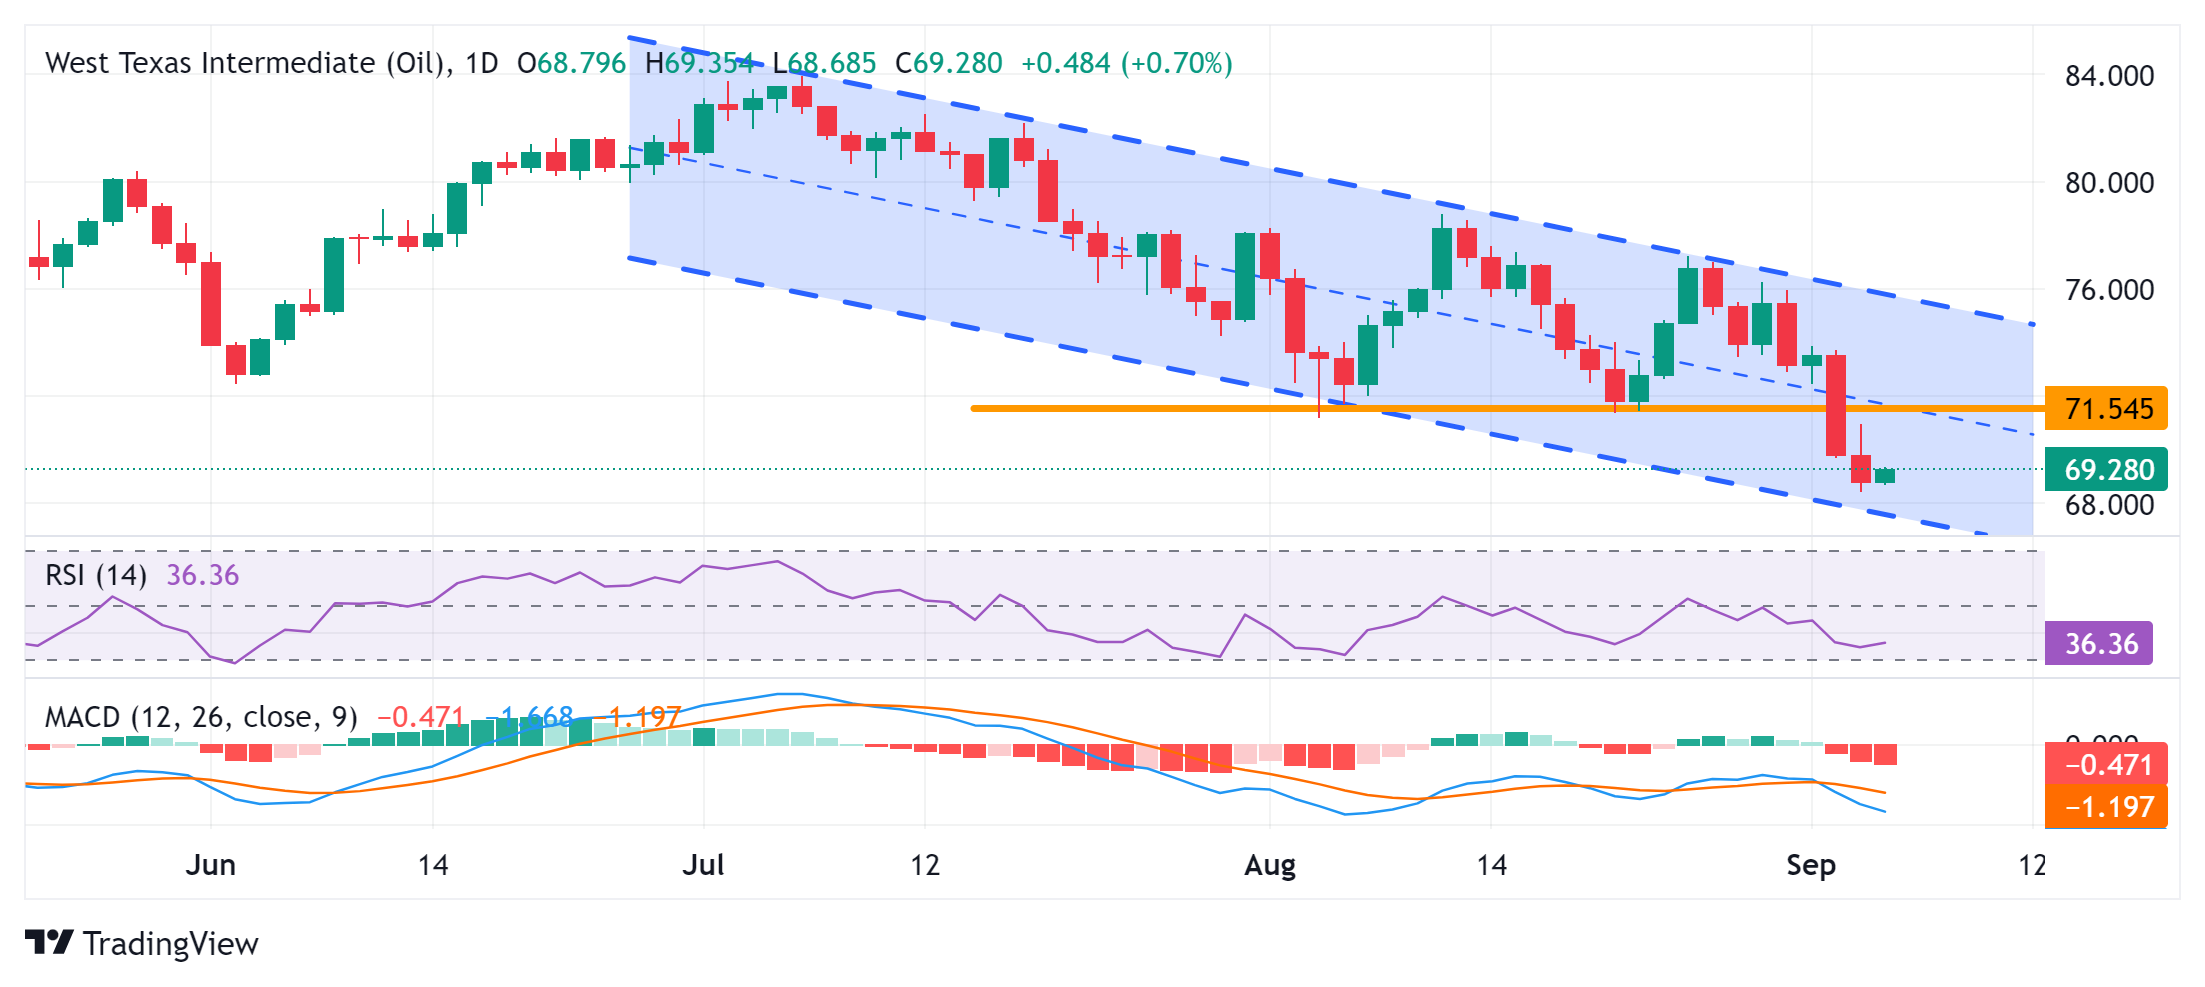
Crude Oil prices have been trending lower along a downward-sloping channel since early Jul. Adding to this, the commodity this week broke down through the $71.50 horizontal support. Furthermore, oscillators on the daily chart are holding deep in negative territory and are still away from being in the oversold zone. This, in turn, suggests that the path of least resistance for the commodity is to the downside and any meaningful recovery attempt is likely to get sold into, making it prudent to wait for strong follow-through buying before positioning for a further appreciating move.
From current levels, the $69.80 region, closely followed by the $70.00 psychological mark, might act as an immediate hurdle ahead of the overnight swing high, just below the $71.00 round figure. The subsequent move up could confront a stiff barrier and remain capped near the aforementioned support breakpoint, now turned resistance, near the $71.50 horizontal zone. The latter should act as a key pivotal point, which if cleared decisively should trigger a short-covering rally, which should allow Crude Oil prices to surpass the $72.50 intermediate resistance and aim to reclaim the $73.00 mark.
On the flip side, the YTD low, around the $68.45 region, could protect the immediate downside ahead of the $68.00 mark and the descending channel support, currently pegged near the $67.70-$67.65 area. A convincing break below the latter will be seen as a fresh trigger for bearish traders and drag Crude Oil prices to sub-$67.00 levels, or June 2023 swing low.
WTI daily chart
WTI Oil FAQs
WTI Oil is a type of Crude Oil sold on international markets. The WTI stands for West Texas Intermediate, one of three major types including Brent and Dubai Crude. WTI is also referred to as “light” and “sweet” because of its relatively low gravity and sulfur content respectively. It is considered a high quality Oil that is easily refined. It is sourced in the United States and distributed via the Cushing hub, which is considered “The Pipeline Crossroads of the World”. It is a benchmark for the Oil market and WTI price is frequently quoted in the media.
Like all assets, supply and demand are the key drivers of WTI Oil price. As such, global growth can be a driver of increased demand and vice versa for weak global growth. Political instability, wars, and sanctions can disrupt supply and impact prices. The decisions of OPEC, a group of major Oil-producing countries, is another key driver of price. The value of the US Dollar influences the price of WTI Crude Oil, since Oil is predominantly traded in US Dollars, thus a weaker US Dollar can make Oil more affordable and vice versa.
The weekly Oil inventory reports published by the American Petroleum Institute (API) and the Energy Information Agency (EIA) impact the price of WTI Oil. Changes in inventories reflect fluctuating supply and demand. If the data shows a drop in inventories it can indicate increased demand, pushing up Oil price. Higher inventories can reflect increased supply, pushing down prices. API’s report is published every Tuesday and EIA’s the day after. Their results are usually similar, falling within 1% of each other 75% of the time. The EIA data is considered more reliable, since it is a government agency.
OPEC (Organization of the Petroleum Exporting Countries) is a group of 13 Oil-producing nations who collectively decide production quotas for member countries at twice-yearly meetings. Their decisions often impact WTI Oil prices. When OPEC decides to lower quotas, it can tighten supply, pushing up Oil prices. When OPEC increases production, it has the opposite effect. OPEC+ refers to an expanded group that includes ten extra non-OPEC members, the most notable of which is Russia.
Author

Haresh Menghani
FXStreet
Haresh Menghani is a detail-oriented professional with 10+ years of extensive experience in analysing the global financial markets.


