WTI Price Forecast: Climbs to one-week high; bulls await move beyond $65.00 mark
- WTI attracts buyers for the second straight day amid concerns about supply disruptions.
- The technical setup favors bulls and backs the case for further near-term appreciation.
- Any corrective decline towards the $64.00 mark could be seen as a buying opportunity.

West Texas Intermediate (WTI) US Crude Oil prices edge higher for the second straight day – also marking the fourth day of a positive move in the previous five – and climb to an over one-week high during the Asian session on Tuesday. The commodity currently trades around the $64.65 region, up 0.35% for the day, bolstered by an escalation of the conflict between Russia and Ukraine.
The recent Ukrainian drone attacks targeted Russian energy facilities, shutting down facilities accounting for at least 17% of Russia's oil processing capacity, or 1.1 million barrels per day. This raises concerns about supply disruptions from Russia – the world’s second largest exporter – and turns out to be a key factor acting as a tailwind for the black liquid and backs the case for additional gains.
Investors, however, might wait for the Organization of the Petroleum Exporting Countries and their allies (OPEC+) meeting on September 7, for clues on further output hikes from the group. This, along with important US macro releases scheduled at the beginning of a new month, should provide some meaningful impetus to Crude Oil prices and help in determining the next leg of a directional move.
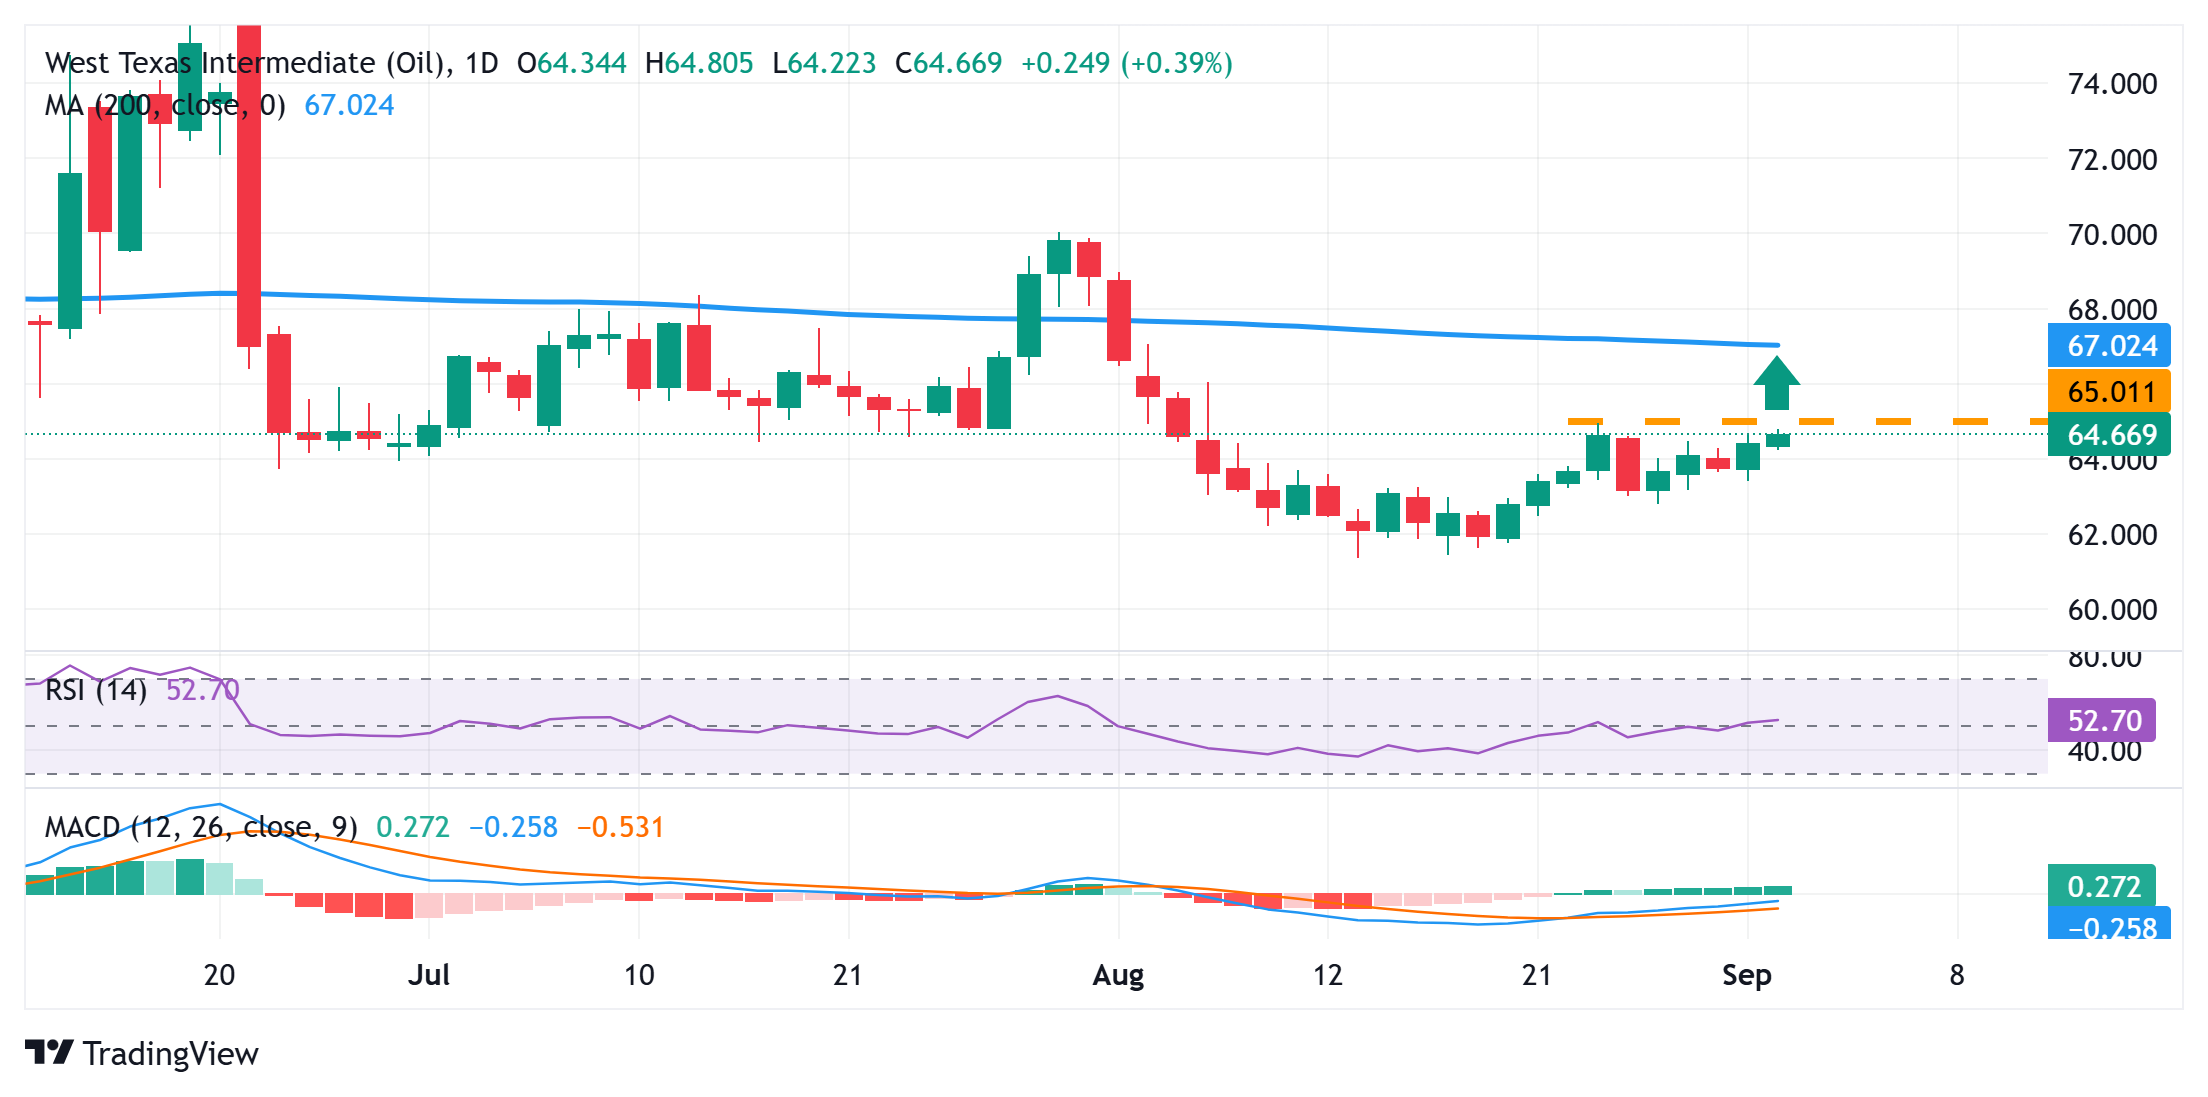
From a technical perspective, last week's swing high, around the $65.00 neighborhood, could act as an immediate hurdle. Given that oscillators on the daily chart have just started gaining positive traction, some follow-through buying should pave the way for additional gains. Crude Oil prices might then climb to the $65.65 barrier before aiming to reclaim the $66.00 mark and test the $66.20-$66.25 hurdle.
On the flip side, the $64.00 round figure could offer immediate support ahead of the $63.70 region. A convincing break below the latter could drag Crude Oil prices to the $63.00 mark, below which the downward trajectory could extend further towards the $62.60-$62.50 region en route to the $62.00 handle. The latter should act as a key pivotal point, which, if broken, will be seen as a fresh trigger for bears.
WTI daily chart
WTI Oil FAQs
WTI Oil is a type of Crude Oil sold on international markets. The WTI stands for West Texas Intermediate, one of three major types including Brent and Dubai Crude. WTI is also referred to as “light” and “sweet” because of its relatively low gravity and sulfur content respectively. It is considered a high quality Oil that is easily refined. It is sourced in the United States and distributed via the Cushing hub, which is considered “The Pipeline Crossroads of the World”. It is a benchmark for the Oil market and WTI price is frequently quoted in the media.
Like all assets, supply and demand are the key drivers of WTI Oil price. As such, global growth can be a driver of increased demand and vice versa for weak global growth. Political instability, wars, and sanctions can disrupt supply and impact prices. The decisions of OPEC, a group of major Oil-producing countries, is another key driver of price. The value of the US Dollar influences the price of WTI Crude Oil, since Oil is predominantly traded in US Dollars, thus a weaker US Dollar can make Oil more affordable and vice versa.
The weekly Oil inventory reports published by the American Petroleum Institute (API) and the Energy Information Agency (EIA) impact the price of WTI Oil. Changes in inventories reflect fluctuating supply and demand. If the data shows a drop in inventories it can indicate increased demand, pushing up Oil price. Higher inventories can reflect increased supply, pushing down prices. API’s report is published every Tuesday and EIA’s the day after. Their results are usually similar, falling within 1% of each other 75% of the time. The EIA data is considered more reliable, since it is a government agency.
OPEC (Organization of the Petroleum Exporting Countries) is a group of 12 Oil-producing nations who collectively decide production quotas for member countries at twice-yearly meetings. Their decisions often impact WTI Oil prices. When OPEC decides to lower quotas, it can tighten supply, pushing up Oil prices. When OPEC increases production, it has the opposite effect. OPEC+ refers to an expanded group that includes ten extra non-OPEC members, the most notable of which is Russia.
Author

Haresh Menghani
FXStreet
Haresh Menghani is a detail-oriented professional with 10+ years of extensive experience in analysing the global financial markets.