|

WTI Price Analysis: Testing the $80 level on broad US Dollar

  • Crude oil prices retreat alongside equities at the beginning of the week.
  • OPEC+'s decision to trim oil output in early April revived growth-related concerns.
  • WTI is technically neutral in the near term but holding within a well-limited range.

Crude oil prices are down on Monday as a risk-off mood underpins the American currency. The black gold stands a few cents above an intraday low of $79.71 a barrel and is nearing its latest range's base.

OPEC+ oil output cut

Early April, the Organization of the Oil Exporting Countries and Allies (OPEC+) surprised market players by announcing a cut in their oil output of around 1.16 million barrels per day, pushing West Texas Intermediate (WTI) roughly 5.5% higher on April 3, leaving a $4 unfilled gap. WTI has been consolidating between $79 and $81.80 since the announcement, unable to find fresh directional impetus.

Higher energy prices have been partially responsible for skyrocketing inflation, and OPEC+'s decision came as a complete shock and revived concerns not only about price pressure but also about economic growth.

Technical Outlook

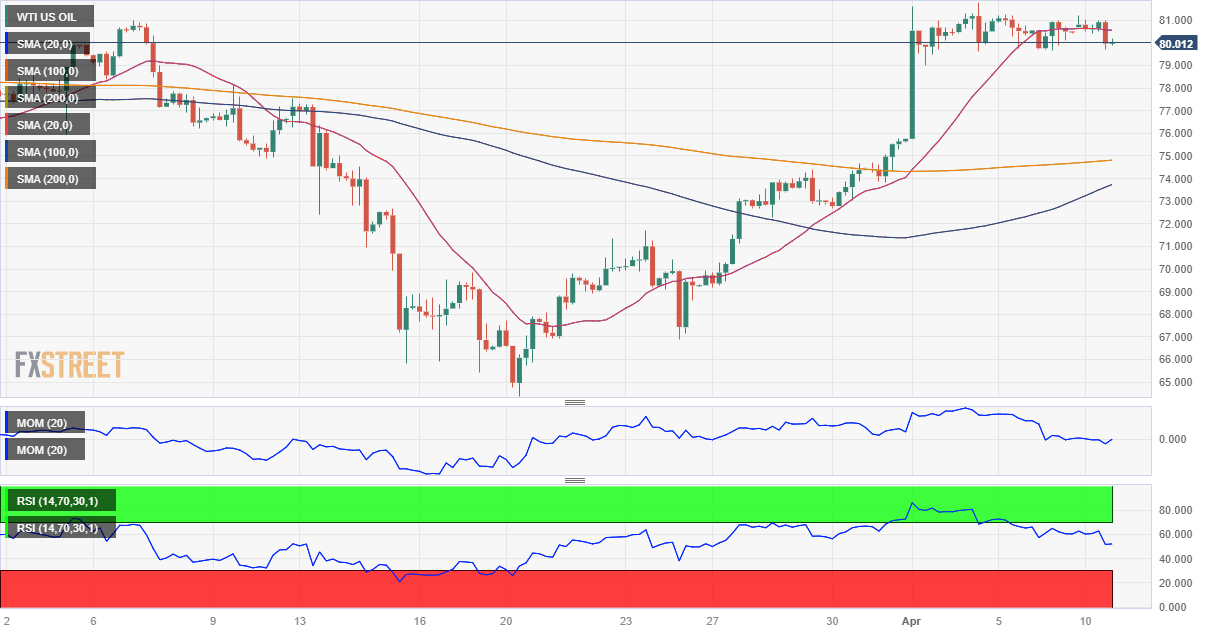
The United States crude oil consolidative phase gives no signs of changing in the near term. Technical indicators are flat in intraday charts, with modest downward slopes, which only reflect the absence of buying interest but fell short of supporting a steeper decline.

The base of the range comes as a strong static support level, with a break below $79.00 favoring a downward extension towards the $75.60 area, where the pair closed on March 31. On the other hand, the pair could accelerate its advance towards $82.65, this year's high, once above the aforementioned $81.80. 

WTI US OIL

Overview
Today last price80.07
Today Daily Change-0.41
Today Daily Change %-0.51
Today daily open80.48
 
Trends
Daily SMA2073.22
Daily SMA5075.74
Daily SMA10076.8
Daily SMA20083.09
 
Levels
Previous Daily High80.97
Previous Daily Low79.68
Previous Weekly High81.81
Previous Weekly Low75.76
Previous Monthly High80.99
Previous Monthly Low64.39
Daily Fibonacci 38.2%80.48
Daily Fibonacci 61.8%80.17
Daily Pivot Point S179.79
Daily Pivot Point S279.09
Daily Pivot Point S378.5
Daily Pivot Point R181.07
Daily Pivot Point R281.66
Daily Pivot Point R382.36

Author

More from FXStreet Team
Share:

Markets move fast. We move first.

Orange Juice Newsletter brings you expert driven insights - not headlines. Every day on your inbox.

By subscribing you agree to our Terms and conditions.

Editor's Picks

EUR/USD holds around 1.1750 after weak German and EU PMI data

EUR/USD maintains its range trade at around 1.1750 in European trading on Tuesday. Weaker-than-expected December PMI data from Germany and the Eurozone make it difficult for the Euro to find demand, while investors refrain from taking large USD positions ahead of key employment data.

GBP/USD climbs above 1.3400 after upbeat UK PMI data

GBP/USD gains traction and trades in positive territory above 1.3400 on Tuesday as the British Pound benefits from upbeat PMI data. Later in the day, crucial data releases from the US, including Nonfarm Payrolls, Retail Sales and PMI, could trigger the next big action in the pair.

Gold retreats from seven week highs on profit-taking; all eyes on US NFP release

Gold price loses momentum below $4,300 during the early European trading hours on Tuesday, pressured by some profit-taking and weak long liquidation from the shorter-term futures traders. Furthermore, optimism around Ukraine peace talks could weigh on the safe-haven asset like Gold.

US Nonfarm Payrolls expected to point to cooling labor market in November

The United States Bureau of Labor Statistics will release the delayed Nonfarm Payrolls (NFP) data for October and November on Tuesday at 13:30 GMT. Economists expect Nonfarm Payrolls to rise by 40,000 in November. The Unemployment Rate is likely to remain unchanged at 4.4% during the same period.

Ukraine-Russia in the spotlight once again

Since the start of the week, gold’s price has moved lower, but has yet to erase the gains made last week. In today’s report we intend to focus on the newest round of peace talks between Russia and Ukraine, whilst noting the release of the US Employment data later on day and end our report with an update in regards to the tensions brewing in Venezuela.

BNB Price Forecast: BNB slips below $855 as bearish on-chain signals and momentum indicators turn negative

BNB, formerly known as Binance Coin, continues to trade down around $855 at the time of writing on Tuesday, after a slight decline the previous day. Bearish sentiment further strengthens as BNB’s on-chain and derivatives data show rising retail activity.