WTI Price Analysis: Slides towards $78.30 on breaking weekly support
- WTI crude oil refreshes weekly low as it breaks short-term key support.
- Convergence of 50-SMA, 61.8% Fibonacci retracement restricts immediate downside.
- Two-week-old ascending support line, 76.85 support confluence to test the bears.
- Upside momentum remains elusive below $81.00 round figure.

WTI takes offers to renew weekly bottom around $78.50 during early Thursday in Europe. In doing so, the black gold bears cheer the downside break of a one-week-old ascending trend line support, now resistance, amid bearish MACD signals and downbeat RSI conditions.
It’s worth noting, however, that a convergence of the 50-SMA and the 61.8% Fibonacci retracement level of the quote’s weakness during early December, near $78.30, appears a tough nut to crack for the short-term WTI bears.
In a case where the energy benchmark remains weaker past $78.30, an upward-sloping support line from January 05, close to $77.50, could probe the oil bears.
Also acting as the key downside filter is the $76.85-80 support confluence that encompasses the 200-SMA and the 50% Fibonacci retracement level of the aforementioned move in December.
It should be observed that the RSI is declining towards the oversold territory and hence the quote’s downside past $76.80 appears difficult.
Meanwhile, recovery moves need to cross the support-turned-resistance line, close to $80.30, to recall the WTI bulls.
Even so, a horizontal area comprising the levels marked during late December and early January, close to $81.00-10, may further check the upside momentum.
WTI: Four-hour chart
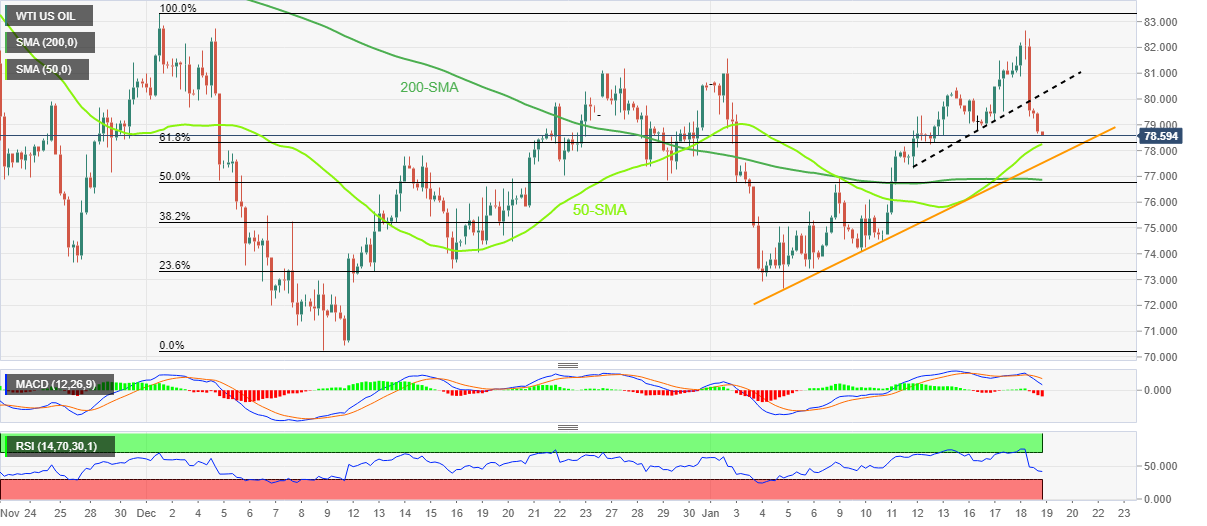
Trend: Further downside expected
Author

Anil Panchal
FXStreet
Anil Panchal has nearly 15 years of experience in tracking financial markets. With a keen interest in macroeconomics, Anil aptly tracks global news/updates and stays well-informed about the global financial moves and their implications.


