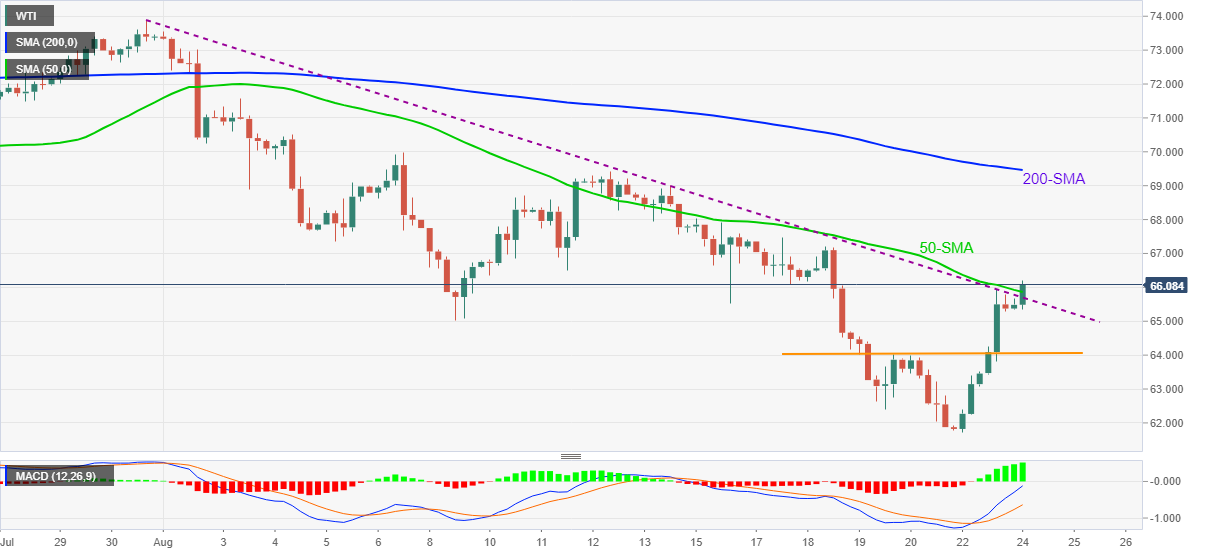
WTI Price Analysis: Pierces the key hurdle to north of $66.00
- WTI refreshes one-week high on crossing monthly resistance line, 50-SMA.
- Bullish MACD hints at further upside towards 200-SMA.
- August 19-20 swing high, monthly low add to the downside filters.

WTI crude oil prices take the bid near $66.08, up 1.0% intraday, during early Tuesday. In doing so, the black gold rises past 50-SMA and a downward sloping trend line from July 30 to refresh the one-week high.
Given the bullish MACD signal joining the resistance breakout, WTI is up for further advances towards the mid-August top surrounding $69.40.
However, 200-SMA near $69.50 and the $70.00 threshold, will challenge the oil buyers afterward.
Meanwhile, the resistance-turned-support confluence comprising the stated SMA And trend line around $65.80-70 restricts the commodity’s immediate downside.
Also restricting short-term WTI sellers is the early August lows near $65.00 and August 19 swing high around $64.00, a break of which will direct the bears to the monthly low close to $61.70.
It’s worth mentioning that the yearly bottom surrounding $61.50 and the $60.00 psychological magnet become the key support to watch past $61.70.
WTI: Four-hour chart
Trend: Further upside expected
Author

Anil Panchal
FXStreet
Anil Panchal has nearly 15 years of experience in tracking financial markets. With a keen interest in macroeconomics, Anil aptly tracks global news/updates and stays well-informed about the global financial moves and their implications.


