WTI Price Analysis: On offer below $61.00, bearish flag in focus
- WTI extends the previous day’s pullback from $62.00.
- Bearish chart pattern, downbeat MACD and sustained trading below key moving average s favor sellers.
- One-week-old falling trend line adds to the upside barriers.

WTI stands on the slippery grounds near $60.80, down 0.80% intraday, during early Tuesday. In doing so, the black gold stays depressed for the second consecutive day inside a bearish flag.
Also suggesting the quote’s further losses could be bearish MACD signals and firm trading below 100 and 200-HMAs, not to forget a downward slopping resistance line from March 15.
It should, however, be noted that the stated flag’s support, at $60.30 now, can test the oil bears before driving them down towards January tops near $54.00.
Though, lows marked during early February around $57.30 may offer an intermediate halt during the fall.
Meanwhile, the corrective pullback will have to cross the 100-HMA level of $62.23 before challenging the bearish chart pattern, by eyeing an upside break of $62.45.
Even so, a short-term resistance line and 200-HMA, respectively around $63.50 and $63.80, will challenge the WTI bull’s return.
WTI hourly chart
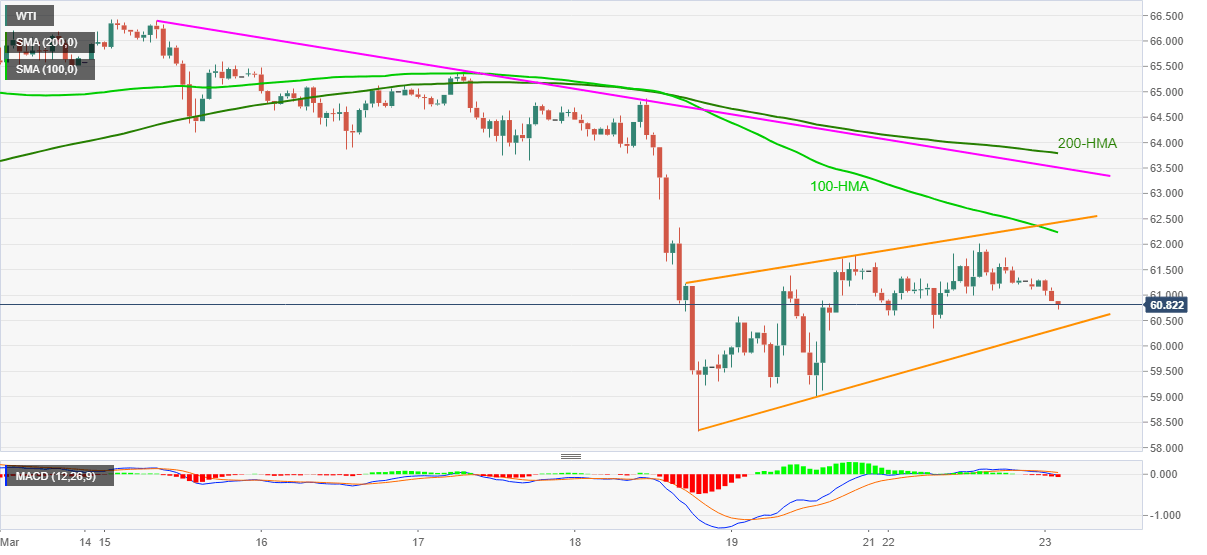
Trend: Bearish
Author

Anil Panchal
FXStreet
Anil Panchal has nearly 15 years of experience in tracking financial markets. With a keen interest in macroeconomics, Anil aptly tracks global news/updates and stays well-informed about the global financial moves and their implications.


