|

WTI Price Analysis: Oil ignores China-linked optimism at three-month high near $79.00 amid overbought RSI

  • WTI struggles to cheer China inspired risk-on mood amid overbought RSI.
  • Five-week-old rising support line tests Oil buyers at multi-month high.
  • Sustained break of 200-DMA, previous key resistance line keeps energy bulls hopeful.
  • Rising wedge bearish chart formation teases WTI sellers but $76.40 appears the key to confirm downside.

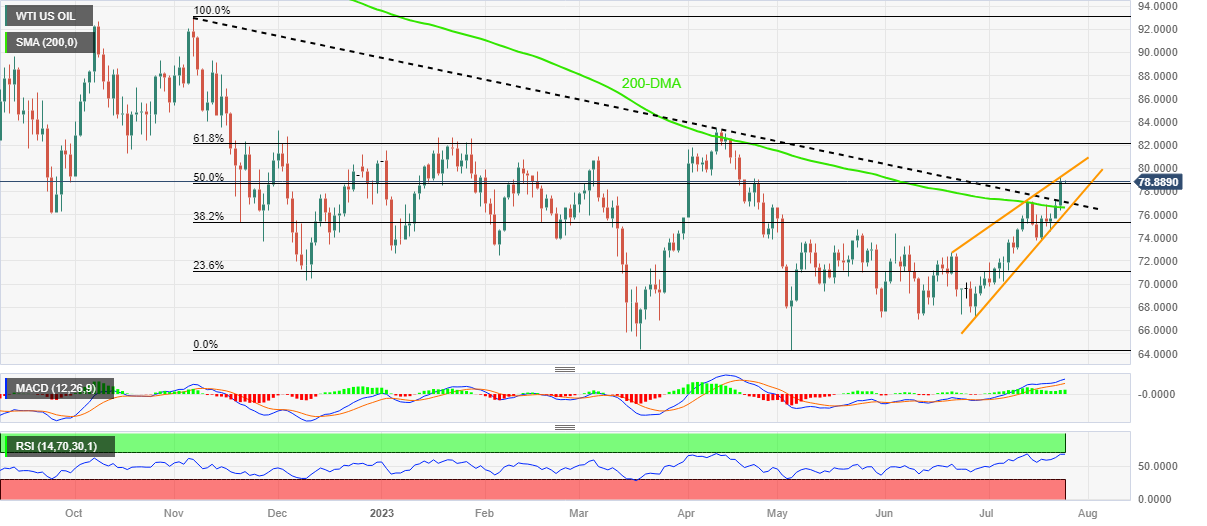
WTI crude oil remains sidelined at the highest levels since late February, marked the previous day, as it fails to justify China-driven upbeat sentiment during early Tuesday. In doing so, the black gold seesaws around $78.90 by the press time amid overbought RSI (14) line.

Also read: S&P500 Futures struggle to justify optimism in China, Hong Kong amid sluggish yields, pre-Fed anxiety

Apart from the RSI conditions, the top line of a five-week-old rising wedge bearish chart pattern, around $79.50 by the press time, also challenges the Oil buyers.

However, a clear upside break of the 200-DMA and the previously important resistance line stretched from November 2022, respectively near $76.60 and $76.90, keeps the WTI bulls hopeful.

With this, the black gold is likely to edge higher and hence can cross the $79.50 hurdle, which in turn highlights the $80.00 psychological magnet for energy bulls to watch afterward.

In a case where the WTI remains firer past the $80.00 threshold despite overbought RSI, the 61.8% Fibonacci retracement of its November 2022 to May 2023 downside, near $82.15, and April’s peak of $83.40 will be crucial to watch.

Meanwhile, a downside break of the previous support line and the 200-DMA isn’t likely to convince the Oil sellers unless the commodity confirms the rising wedge bearish chart pattern with a daily closing below $76.40.

WTI crude oil: Daily chart

Trend: Pullback expected

Additional important levels

Overview
Today last price78.87
Today Daily Change0.03
Today Daily Change %0.04%
Today daily open78.84
 
Trends
Daily SMA2073.43
Daily SMA5072.04
Daily SMA10073.5
Daily SMA20076.64
 
Levels
Previous Daily High79.19
Previous Daily Low76.38
Previous Weekly High77.23
Previous Weekly Low73.78
Previous Monthly High74.36
Previous Monthly Low66.95
Daily Fibonacci 38.2%78.12
Daily Fibonacci 61.8%77.45
Daily Pivot Point S177.08
Daily Pivot Point S275.32
Daily Pivot Point S374.27
Daily Pivot Point R179.89
Daily Pivot Point R280.95
Daily Pivot Point R382.7

Author

Anil Panchal

Anil Panchal

FXStreet

Anil Panchal has nearly 15 years of experience in tracking financial markets. With a keen interest in macroeconomics, Anil aptly tracks global news/updates and stays well-informed about the global financial moves and their implications.

More from Anil Panchal
Share:

Editor's Picks

GBP/USD clings to daily gains near 1.3350

GBP/USD holds just in positive territory around 1.3350 on Friday as the Greenback keeps a vacillating price action. With Fed rate hike expectations easing and US markets closed for the Independence Day holiday, Cable remains on track to post solid weekly gains.

EUR/USD remains sidelined around 1.1440

EUR/USD holds on to its recent gains and consolidates around 1.1440 at the end of the week as the US Dollar lacks clear direction. In the meantime, trading conditions remain subdued, with volatility constrained by the closure of US markets for the Independence Day holiday.

Gold flirts with two-week highs, targets $4,200

Gold extends its recovery for a third straight day, advancing toward the $4,200 mark per troy ounce on Friday. The precious metal looks set to snap a four-week losing streak as softer-than-expected June US NFP data prompt investors to scale back expectations of further Fed tightening.

Crypto Today: Bitcoin, Ethereum, XRP advance amid renewed capital inflows

Bitcoin maintains its upward momentum, holding above the $61,000 mark at the time of writing on Friday. Major altcoins such as Ethereum and Ripple are also posting gains, signaling a modest uptick in market sentiment and renewed risk appetite among investors.

The Iran war failed to trigger a recession. Can the US economy keep defying expectations?

Nearly four months after the start of the Iran war, the US economy remains remarkably resilient. While the conflict initially triggered a severe disruption to global energy markets and a sharp rise in Oil prices, recent diplomatic progress between Washington and Tehran has eased concerns about a prolonged supply shock.

Kevin Warsh offers no policy clues: Why markets still got their answer

Financial markets came to Sintra looking for clues about the Federal Reserve's (Fed) next move. They largely left with confirmation that Fed Chair Kevin Warsh intends to make those clues much harder to find.