|

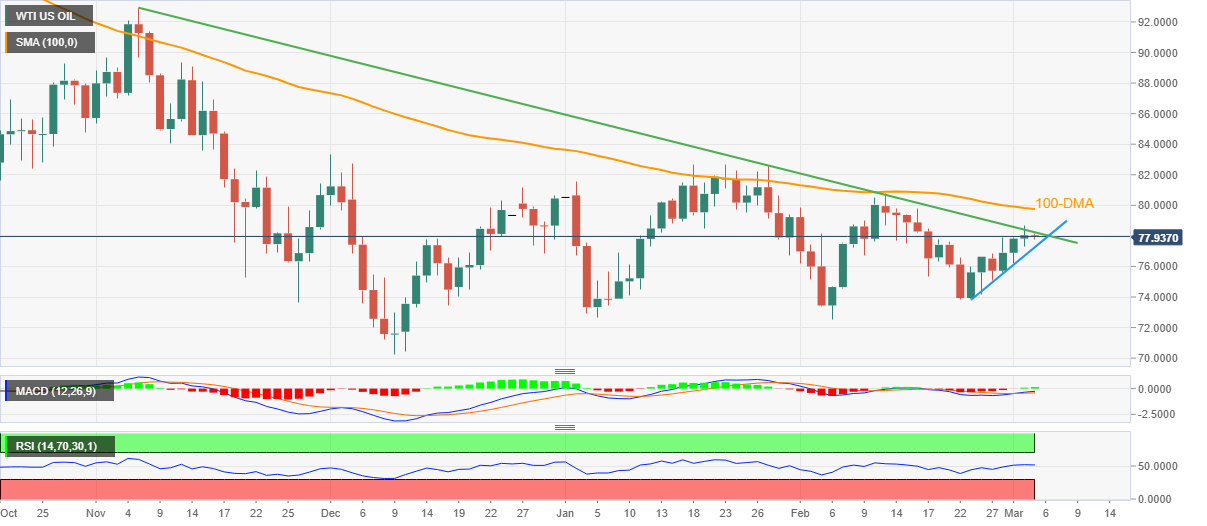
WTI Price Analysis: Oil buyers poke multi-day-old resistance line, $78.30 is the key

  • WTI crude oil price struggles around two-week high, eases from four-month-old resistance line of late.
  • Recently firmer MACD signals, upbeat RSI (14) hints at the quote’s further upside, 100-DMA acts as additional resistance.
  • WTI bears remain off the table unless the quote stays beyond one-week-old support line.

WTI crude oil buyers take a breather around a fortnight high, printing mild losses near the $78.00 threshold during early Friday. In doing so, the black gold price retreats from a four-month-long resistance line, as well as snapping a three-day winning streak.

It’s worth noting that the bullish MACD signals and the firmer RSI (14), not overbought, joins the quote’s successful trading above the one-week-long ascending support line to keep the WTI bulls hopeful of overcoming the adjacent resistance line, close to $78.30 at the latest.

However, the 100-DMA hurdle surrounding $79.75 and the $80.00 round figure acts as an extra filter towards the north.

In a case where the Oil price remains firmer past $80.00, tops marked in January 2023 and December 2022, respectively near $82.55 and $83.30, could lure the commodity bulls.

Alternatively, pullback moves appear unimpressive beyond the aforementioned support line stretched from the last Friday, close to $77.25 at the latest.

Following that, a quick drop to the previous weekly low of $73.85 can’t be ruled out. Though, a clear downside break of $73.85 will highlight February’s bottom and December 2022 lows, close to $72.50 and $70.25, as the key support to watch during the commodity’s further downside.

WTI: Daily chart

Trend: Further upside  expected

Additional important levels

Overview
Today last price77.95
Today Daily Change-0.09
Today Daily Change %-0.12%
Today daily open78.04
 
Trends
Daily SMA2077.14
Daily SMA5078.02
Daily SMA10079.82
Daily SMA20087.93
 
Levels
Previous Daily High78.65
Previous Daily Low77.3
Previous Weekly High77.75
Previous Weekly Low73.86
Previous Monthly High80.75
Previous Monthly Low72.5
Daily Fibonacci 38.2%78.14
Daily Fibonacci 61.8%77.82
Daily Pivot Point S177.34
Daily Pivot Point S276.65
Daily Pivot Point S375.99
Daily Pivot Point R178.7
Daily Pivot Point R279.35
Daily Pivot Point R380.05

Author

Anil Panchal

Anil Panchal

FXStreet

Anil Panchal has nearly 15 years of experience in tracking financial markets. With a keen interest in macroeconomics, Anil aptly tracks global news/updates and stays well-informed about the global financial moves and their implications.

More from Anil Panchal
Share:

Markets move fast. We move first.

Orange Juice Newsletter brings you expert driven insights - not headlines. Every day on your inbox.

By subscribing you agree to our Terms and conditions.

Editor's Picks

EUR/USD rebounds after falling toward 1.1700

EUR/USD gains traction and trades above 1.1730 in the American session, looking to end the week virtually unchanged. The bullish opening in Wall Street makes it difficult for the US Dollar to preserve its recovery momentum and helps the pair rebound heading into the weekend.

GBP/USD steadies below 1.3400 as traders assess BoE policy outlook

Following Thursday's volatile session, GBP/USD moves sideways below 1.3400 on Friday. Investors reassess the Bank of England's policy oıtlook after the MPC decided to cut the interest rate by 25 bps by a slim margin. Meanwhile, the improving risk mood helps the pair hold its ground.

Gold stays below $4,350, looks to post small weekly gains

Gold struggles to gather recovery momentum and stays below $4,350 in the second half of the day on Friday, as the benchmark 10-year US Treasury bond yield edges higher. Nevertheless, the precious metal remains on track to end the week with modest gains as markets gear up for the holiday season.

Crypto Today: Bitcoin, Ethereum, XRP rebound amid bearish market conditions

Bitcoin (BTC) is edging higher, trading above $88,000 at the time of writing on Monday. Altcoins, including Ethereum (ETH) and Ripple (XRP), are following in BTC’s footsteps, experiencing relief rebounds following a volatile week.

How much can one month of soft inflation change the Fed’s mind?

One month of softer inflation data is rarely enough to shift Federal Reserve policy on its own, but in a market highly sensitive to every data point, even a single reading can reshape expectations. November’s inflation report offered a welcome sign of cooling price pressures. 

XRP rebounds amid ETF inflows and declining retail demand demand

XRP rebounds as bulls target a short-term breakout above $2.00 on Friday. XRP ETFs record the highest inflow since December 8, signaling growing institutional appetite.