|

WTI Price Analysis: Oil buyers poke $72.50 within weekly triangle

  • WTI crude oil remains firmer inside one-week-old symmetrical triangle, eyes the first weekly gain in five.
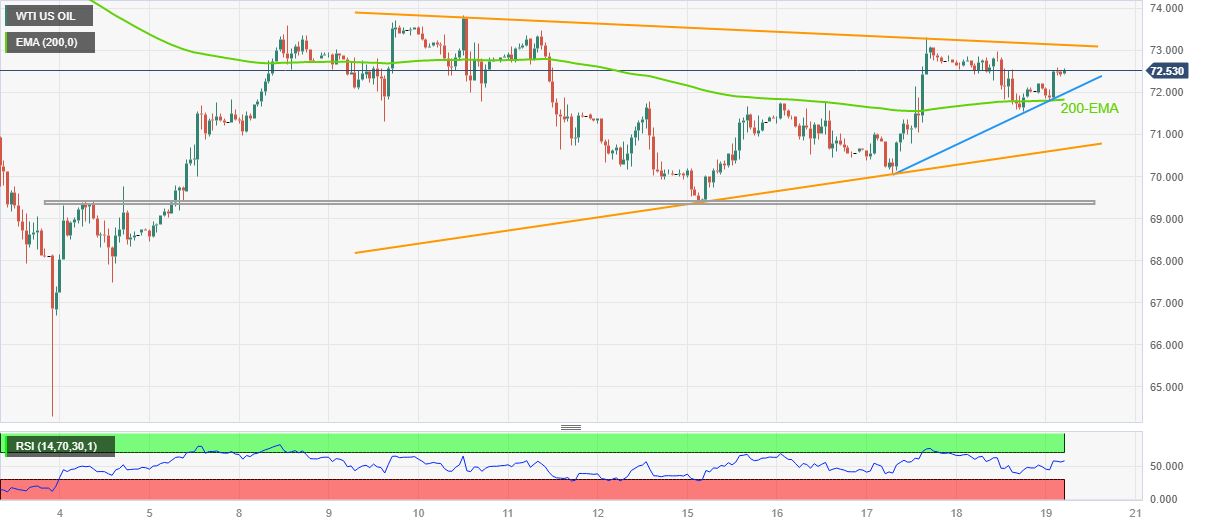
  • Firmer RSI (14) line, not overbought, joins sustained trading beyond 200-EMA to defend energy bulls.
  • Oil sellers remain off the table beyond $70.70, multiple hurdle to challenge bears afterward.

WTI crude oil picks up bids to print 0.50% intraday gains near $72.50 as it appears well-set to snap a four-week downtrend amid early Friday. In doing so, the black gold rises inside a one-week-old symmetrical triangle.

Given the quote’s successful trading past an upward-sloping trend line from the last Wednesday, near $71.95 by the press time, as well as the capacity to stay beyond the 200-hour Exponential Moving Average (EMA), around $71.80 at the latest, Oil price is likely to remain firmer.

In that case, the stated triangle’s top line surrounding $73.20 becomes a crucial hurdle to watch as a break of which could quickly propel the WTI crude oil price toward the May 10 swing high near $73.80.

It’s worth noting that April’s low near $73.85-90 acts as an extra filter towards the north before directing the Oil buyers to the monthly high of $76.60.

Meanwhile, the aforementioned immediate support line and the 200-EMA, respectively near $71.95 and $71.80, restrict the short-term downside of the WTI crude oil.

Following that, the stated triangle’s bottom line, around $70.70, precedes a fortnight-old horizontal support of near $69.40-30 to challenge the energy bears.

Should the WTI price remains bearish past $69.30, the odds of witnessing a fall toward the monthly low near $64.30 can’t be ruled out.

WTI crude oil price: Hourly chart

Trend: Limited upside expected

Additional important levels

Overview
Today last price72.55
Today Daily Change0.53
Today Daily Change %0.74%
Today daily open72.02
 
Trends
Daily SMA2073.07
Daily SMA5074.58
Daily SMA10076.27
Daily SMA20080.12
 
Levels
Previous Daily High72.96
Previous Daily Low71.54
Previous Weekly High73.81
Previous Weekly Low69.94
Previous Monthly High83.4
Previous Monthly Low73.88
Daily Fibonacci 38.2%72.08
Daily Fibonacci 61.8%72.42
Daily Pivot Point S171.38
Daily Pivot Point S270.75
Daily Pivot Point S369.96
Daily Pivot Point R172.81
Daily Pivot Point R273.6
Daily Pivot Point R374.23

Author

Anil Panchal

Anil Panchal

FXStreet

Anil Panchal has nearly 15 years of experience in tracking financial markets. With a keen interest in macroeconomics, Anil aptly tracks global news/updates and stays well-informed about the global financial moves and their implications.

More from Anil Panchal
Share:

Markets move fast. We move first.

Orange Juice Newsletter brings you expert driven insights - not headlines. Every day on your inbox.

By subscribing you agree to our Terms and conditions.

Editor's Picks

EUR/USD moves sideways below 1.1800 on Christmas Eve

EUR/USD struggles to find direction and trades in a narrow channel below 1.1800 after posting gains for two consecutive days. Bond and stock markets in the US will open at the usual time and close early on Christmas Eve, allowing the trading action to remain subdued. 

GBP/USD keeps range around 1.3500 amid quiet markets

GBP/USD keeps its range trade intact at around 1.3500 on Wednesday. The Pound Sterling holds the upper hand over the US Dollar amid pre-Christmas light trading as traders move to the sidelines heading into the holiday season. 

Gold retreats from record highs, trades below $4,500

Gold retreats after setting a new record-high above $4,520 earlier in the day and trades in a tight range below $4,500 as trading volumes thin out ahead of the Christmas break. The US Dollar selling bias remains unabated on the back of dovish Fed expectations, which continues to act as a tailwind for the bullion amid persistent geopolitical risks.

Bitcoin slips below $87,000 as ETF outflows intensify, whale participation declines

Bitcoin price continues to trade around $86,770 on Wednesday, after failing to break above the $90,000 resistance. US-listed spot ETFs record an outflow of $188.64 million on Tuesday, marking the fourth consecutive day of withdrawals.

Economic outlook 2026-2027 in advanced countries: Solidity test

After a year marked by global economic resilience and ending on a note of optimism, 2026 looks promising and could be a year of solid economic performance. In our baseline scenario, we expect most of the supportive factors at work in 2025 to continue to play a role in 2026.

Avalanche struggles near $12 as Grayscale files updated form for ETF

Avalanche trades close to $12 by press time on Wednesday, extending the nearly 2% drop from the previous day. Grayscale filed an updated form to convert its Avalanche-focused Trust into an ETF with the US Securities and Exchange Commission.