|

WTI Price Analysis: Oil bears eye further downside towards $70.70-60

  • WTI crude oil takes offers to refresh intraday low, drops for the third consecutive day.
  • Clear downside break of key HMAs, sluggish oscillators favor the black gold’s further declines.
  • One-week-old horizontal support can prod energy bears amid nearly oversold RSI, looming bull cross on MACD.

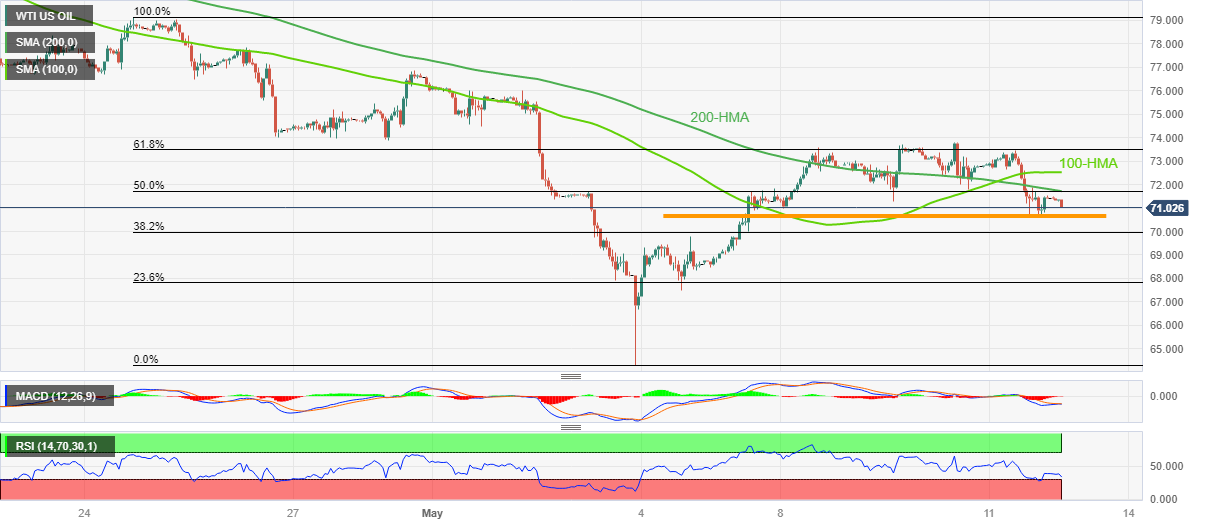
WTI crude oil remains pressured for the third consecutive day after reversing from a one-week high, taking offers to refresh intraday bottom around $71.10 amid early Friday.

In doing so, the energy benchmark justifies the previous day’s downside break of the 100 and 200 Hourly Moving Averages (HMAs). Adding strength to the bearish bias about the black gold are the sluggish conditions of the MACD and RSI indicators, also known as the oscillators.

It’s worth noting that a one-week-old horizontal support area surrounding $70.70-60 joins nears the oversold RSI (14) line to restrict the immediate downside of the WTI crude oil.

Following that, the $70.00 psychological magnet and $69.50 may entertain the Oil sellers before directing them to the recently flashed multi-month low of around $64.30.

On the contrary, a convergence of the 200-HMA and a 50% Fibonacci retracement level of the Oil Price weakness from April 24 to May 03, near $71.70, appears a tough nut to crack for the energy buyers to convince the markets.

Even so, a successful break of the 100-HMA and 61.8% Fibonacci retracement level, also known as the golden Fibonacci ratio, respectively near $72.55 and $73.50, becomes necessary for the WTI bulls to retake control.

WTI crude oil: Hourly chart

Trend: Limited downside expected

Additional important levels

Overview
Today last price71.1
Today Daily Change-0.32
Today Daily Change %-0.45%
Today daily open71.42
 
Trends
Daily SMA2075.27
Daily SMA5075.3
Daily SMA10076.66
Daily SMA20080.57
 
Levels
Previous Daily High73.47
Previous Daily Low70.64
Previous Weekly High76.61
Previous Weekly Low64.31
Previous Monthly High83.4
Previous Monthly Low73.88
Daily Fibonacci 38.2%71.72
Daily Fibonacci 61.8%72.39
Daily Pivot Point S170.22
Daily Pivot Point S269.02
Daily Pivot Point S367.4
Daily Pivot Point R173.05
Daily Pivot Point R274.67
Daily Pivot Point R375.87

Author

Anil Panchal

Anil Panchal

FXStreet

Anil Panchal has nearly 15 years of experience in tracking financial markets. With a keen interest in macroeconomics, Anil aptly tracks global news/updates and stays well-informed about the global financial moves and their implications.

More from Anil Panchal
Share:

Editor's Picks

EUR/USD appears supported by the 200-day SMA, for now

Following an early pullback to multi-week lows near 1.1670, EUR/USD now manages to reclaim the 1.1700 region as the NA session draws to a close on Monday. The steep retracement in spot follows the equally strong move higher in the US Dollar, as investors continue to assess the geopolitical landscape in the wake of the US and Israel attacks on Iran.


GBP/USD hits new yearly lows near 1.3300

GBP/USD adds to the recent bearish tone, approaching to the key 1.3300 support to reach fresh YTD troughs against the backdrop of the robust performance of the US Dollar. Indeed, Cable’s decline comes amid the firm demand for the safe-haven space in the wake of the US and Israel attacks to Iran.

Gold eases some ground, approaches $5,300

Gold now surrenders part of the earlier advance, reshifting its attenton to the $5,300 zone per troy ounce at the beginning of the week. Indeed, the yellow metal’s firm performance appears propped up by incresing geopolitical jitters in the Middle East, which at the same time fuels the demand for the safe-haven space.

Strategy lifts holdings to 3.4% of Bitcoin's total supply amid inflows into crypto products

Strategy continued its accumulation of the top crypto last week, acquiring 3,015 BTC for $204 million amid renewed interest in crypto products after four weeks of outflows.

The Fed is finally talking about AI – Here's why it matters for the US Dollar

AI is moving from earnings calls into the heart of monetary policy discussions, forcing Federal Reserve officials to confront a new question: How to act if AI reshapes inflation, employment and interest rates at the same time?

Grass 20% bullish breakout defies broader market weakness

Grass (GRASS) is edging up above $0.30 at the time of writing on Monday. The token’s notable 20% intraday surge stands out amid heightened volatility in the broader crypto market.