|

WTI Price Analysis: Mildly offered around $69.00 but bulls remain hopeful

  • WTI eases from weekly top, fades break of seven-day-old previous resistance line.
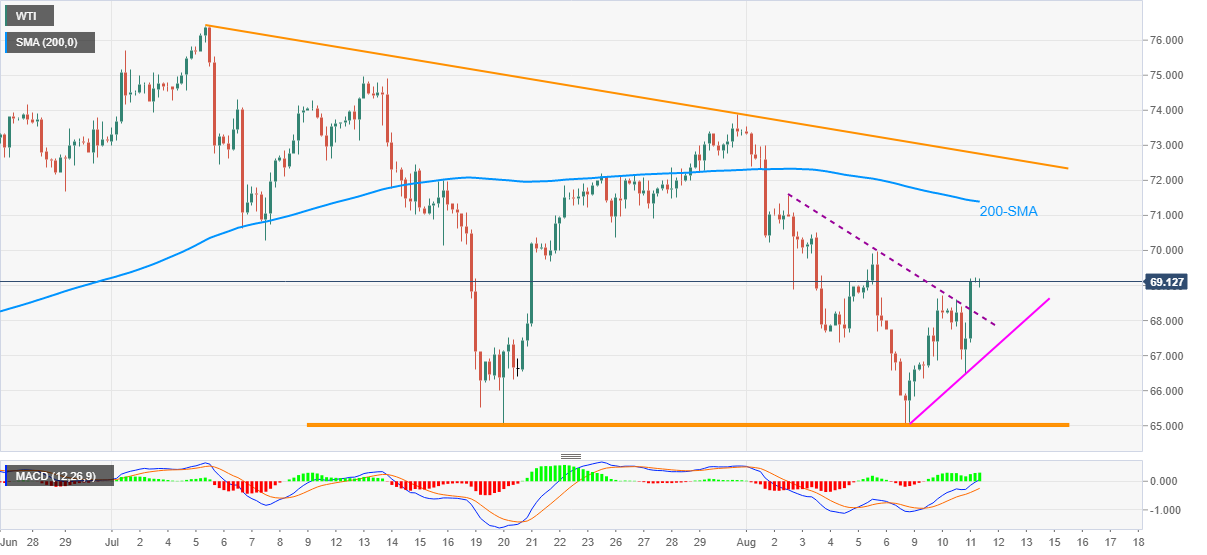
  • Bullish MACD, rebound from $65.00 and immediate rising trend line favor buyers.

WTI oil prices step back from the week’s top to $69.00, down 0.27% intraday, during early Thursday.

The energy benchmark refreshed weekly high after crossing a descending trend line from August 03 the previous day. Also suggesting the quote’s further upside are the bullish MACD signals and an upward sloping support line from Monday.

However, clear trading above $69.00 becomes necessary for the oil buyers to aim for 200-SMA near $71.40. During the rise, the $70.00 threshold may offer an intermediate halt.

It’s worth noting that the resistance line of a five-week-old descending triangle bullish pattern challenges the black gold’s rally beyond 200-SMA around $72.75.

Alternatively, the commodity’s further declines will aim to retest the previous resistance line around $68.10, a break of which will direct WTI sellers to the short-term support line near $66.80.

It should be observed, however, that the quote’s weakness past $66.80 will be questioned by the stated triangle’s support near $65.00, a break of which will convince the oil bears.

WTI: Four-hour chart

Trend: Further recovery expected

Additional important levels

Overview
Today last price69.04
Today Daily Change-0.15
Today Daily Change %-0.22%
Today daily open69.19
 
Trends
Daily SMA2070.04
Daily SMA5071.33
Daily SMA10067.29
Daily SMA20059.78
 
Levels
Previous Daily High69.22
Previous Daily Low66.5
Previous Weekly High73.54
Previous Weekly Low67.36
Previous Monthly High76.4
Previous Monthly Low64.99
Daily Fibonacci 38.2%68.18
Daily Fibonacci 61.8%67.54
Daily Pivot Point S167.39
Daily Pivot Point S265.58
Daily Pivot Point S364.66
Daily Pivot Point R170.11
Daily Pivot Point R271.03
Daily Pivot Point R372.83

Author

Anil Panchal

Anil Panchal

FXStreet

Anil Panchal has nearly 15 years of experience in tracking financial markets. With a keen interest in macroeconomics, Anil aptly tracks global news/updates and stays well-informed about the global financial moves and their implications.

More from Anil Panchal
Share:

Markets move fast. We move first.

Orange Juice Newsletter brings you expert driven insights - not headlines. Every day on your inbox.

By subscribing you agree to our Terms and conditions.

Editor's Picks

EUR/USD declines toward 1.1700 on solid USD recovery

EUR/USD turns south and declines toward 1.1700 on Wednesday. A solid comeback staged by the US Dollar weighs heavily on the pair, as traders look to USD short covering ahead of US CPI on Thursday. However, the downside could be capped by hawkish ECB expectations. 

GBP/USD slides toward 1.3300 after softer-than-expected UK inflation data

GBP/USD has come under intense selling pressure, eyeing 1.3300 in the European session on Wednesday. The UK annual headline and core CPI rose by 3.2% each, missing estimates of 3.5% and 3.4%, respectively, reaffirming dovish BoE expectations and smashing the Pound Sterling across the board. 

Gold clings to modest gains above $4,300

Following Tuesday's volatile action, Gold regains its traction on Wednesday and trades in positive territory above $4,300. While the buildup in the USD recovery momentum caps XAU/USD's upside, the cautious market stance helps ithe pair hold its ground.

Bitcoin, Ethereum and Ripple extend correction as bearish momentum builds

Bitcoin, Ethereum, and Ripple remain under pressure as the broader market continues its corrective phase into midweek. The weak price action of these top three cryptocurrencies by market capitalization suggests a deeper correction, as momentum indicators are beginning to tilt bearish.

Ukraine-Russia in the spotlight once again

Since the start of the week, gold’s price has moved lower, but has yet to erase the gains made last week. In today’s report we intend to focus on the newest round of peace talks between Russia and Ukraine, whilst noting the release of the US Employment data later on day and end our report with an update in regards to the tensions brewing in Venezuela.

AAVE slips below $186 as bearish signals outweigh the SEC investigation closure

Aave (AAVE) price continues its decline, trading below $186 at the time of writing on Wednesday after a rejection at the key resistance zone. Derivatives positioning and momentum indicators suggest that bearish forces still dominate in the near term.