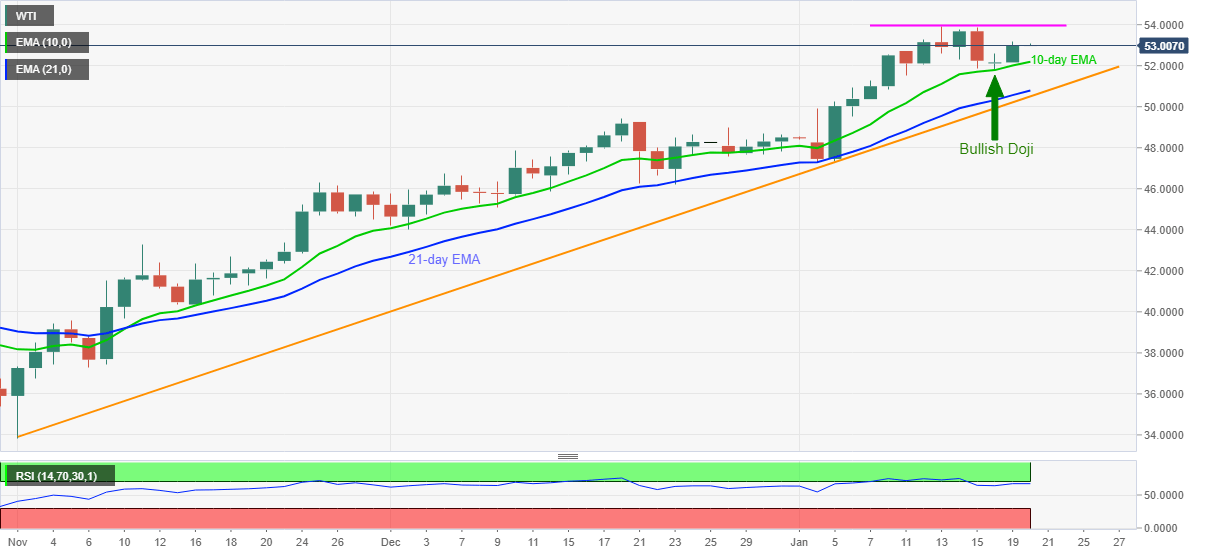
WTI Price Analysis: Keeps recovery moves from short-term EMAs to battle $53.00


  • WTI picks up bids while keeping the previous day’s recovery moves.
  • Monday’s bullish Doji backs sustained trading beyond key supports.
  • RSI conditions can challenge bulls around monthly high.

WTI rises to $53.12 during the initial Asian session trading on Wednesday. In doing so, the energy benchmark extends Tuesday’s recovery moves from 10-day SMA while staying above 21-day SMA and an upward sloping trend line from early November.

Considering the strong RSI conditions, a bit lower than the overbought area, coupled with the quote’s successful trading above key support, a continuation of the uptrend can’t be ruled out. It should also be noted that Monday’s bullish Doji formation also favors the black gold’s further rise.

However, the $53.86-93 area comprising the monthly high, followed by the $54.00 round-figure will challenge the WTI buyers.

Should RSI stay away from the overbought area beyond the $54.00 threshold, February 2020 top near $54.70 will gain the market’s attention.

Alternatively, a downside break of 10-day EMA, currently around $52.20, needs to defy Monday’s doji with a clear decline below $51.80 to convince short-term sellers.

Even so, 21-day EMA and the stated support line, respectively near $50.80 and $50.50, will challenge the WTI sellers ahead of the $50.00 psychological magnet.

To sum up, WTI justifies its upside momentum while staying above key short-term support amid strong RSI conditions, which in turn directs the energy buyers towards the early 2020 tops.

WTI daily chart

Trend: Bullish

Additional important levels

Overview
Today last price 53.01
Today Daily Change 0.85
Today Daily Change % 1.63%
Today daily open 52.16
 
Trends
Daily SMA20 50.02
Daily SMA50 46.92
Daily SMA100 43.23
Daily SMA200 39.4
 
Levels
Previous Daily High 52.6
Previous Daily Low 51.82
Previous Weekly High 53.94
Previous Weekly Low 51.51
Previous Monthly High 49.43
Previous Monthly Low 44.01
Daily Fibonacci 38.2% 52.3
Daily Fibonacci 61.8% 52.12
Daily Pivot Point S1 51.79
Daily Pivot Point S2 51.41
Daily Pivot Point S3 51.01
Daily Pivot Point R1 52.57
Daily Pivot Point R2 52.97
Daily Pivot Point R3 53.34


Share: Feed news

Information on these pages contains forward-looking statements that involve risks and uncertainties. Markets and instruments profiled on this page are for informational purposes only and should not in any way come across as a recommendation to buy or sell in these assets. You should do your own thorough research before making any investment decisions. FXStreet does not in any way guarantee that this information is free from mistakes, errors, or material misstatements. It also does not guarantee that this information is of a timely nature. Investing in Open Markets involves a great deal of risk, including the loss of all or a portion of your investment, as well as emotional distress. All risks, losses and costs associated with investing, including total loss of principal, are your responsibility. The views and opinions expressed in this article are those of the authors and do not necessarily reflect the official policy or position of FXStreet nor its advertisers. The author will not be held responsible for information that is found at the end of links posted on this page.

If not otherwise explicitly mentioned in the body of the article, at the time of writing, the author has no position in any stock mentioned in this article and no business relationship with any company mentioned. The author has not received compensation for writing this article, other than from FXStreet.

FXStreet and the author do not provide personalized recommendations. The author makes no representations as to the accuracy, completeness, or suitability of this information. FXStreet and the author will not be liable for any errors, omissions or any losses, injuries or damages arising from this information and its display or use. Errors and omissions excepted.

The author and FXStreet are not registered investment advisors and nothing in this article is intended to be investment advice.

Recommended content


Recommended content

Editors’ Picks

EUR/USD retreats below 1.0700 after US GDP data

EUR/USD retreats below 1.0700 after US GDP data

EUR/USD came under modest bearish pressure and retreated below 1.0700. Although the US data showed that the economy grew at a softer pace than expected in Q1, strong inflation-related details provided a boost to the USD.

EUR/USD News

GBP/USD declines below 1.2500 as USD rebounds

GBP/USD declines below 1.2500 as USD rebounds

GBP/USD declined below 1.2500 and erased the majority of its daily gains with the immediate reaction to the US GDP report. The US economy expanded at a softer pace than expected in Q1 but the price deflator jumped to 3.4% from 1.8%. 

GBP/USD News

Gold drops below $2,320 as US yields shoot higher

Gold drops below $2,320 as US yields shoot higher

Gold lost its traction and turned negative on the day below $2,320 in the American session on Thursday. The benchmark 10-year US Treasury bond yield is up more than 1% on the day above 4.7% after US GDP report, weighing on XAU/USD.

Gold News

XRP extends its decline, crypto experts comment on Ripple stablecoin and benefits for XRP Ledger

XRP extends its decline, crypto experts comment on Ripple stablecoin and benefits for XRP Ledger

Ripple extends decline to $0.52 on Thursday, wipes out weekly gains. Crypto expert asks Ripple CTO how the stablecoin will benefit the XRP Ledger and native token XRP. 

Read more

After the US close, it’s the Tokyo CPI

After the US close, it’s the Tokyo CPI

After the US close, it’s the Tokyo CPI, a reliable indicator of the national number and then the BoJ policy announcement. Tokyo CPI ex food and energy in Japan was a rise to 2.90% in March from 2.50%.

Read more

Forex MAJORS

Cryptocurrencies

Signatures