|

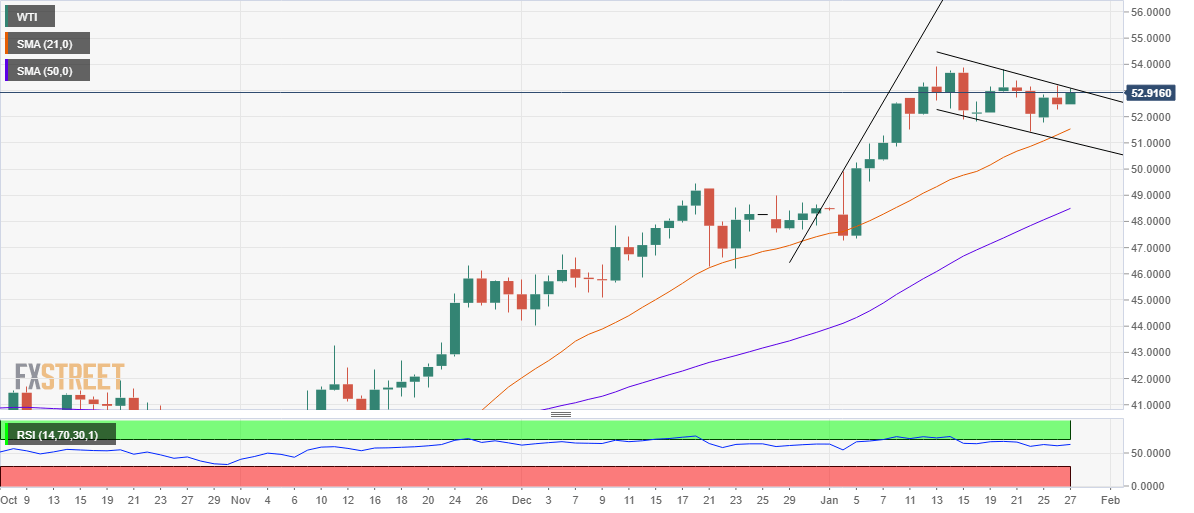
WTI Price Analysis: Focus on Wednesday’s close amid a potential bull flag

  • WTI reverses Tuesday’s losses, looks to extend the recovery. 
  • Daily chart spots a likely bull flag amid bullish RSI.
  • Focus on Wednesday’s close price, EIA and US data.

WTI (futures on NYMEX) battles the $53 mark, reversing most of Tuesday’s losses, as the bulls await the Energy Information Administration (EIA) US crude stockpiles data for fresh directives.

From a near-term technical perspective, the black gold remains in a consolidation phase after recoding multi-month highs at $53.93 on January 13.

The rally in the first week of this month that followed the consolidation charted a bull flag on the daily chart, which could likely get confirmed on a daily closing above $53.09 – the falling trendline resistance.

The bullish breakout would open doors towards the multi-month tops, above which the $55 threshold would be in sight.

The 14-day Relative Strength Index (RSI), currently trades at 63.12, pointing to more gains.

Alternatively, the pattern will get invalidated if the price closes the day below $51.03, the falling trendline support.

Ahead of that level, the 21-daily moving average (DMA) at $51.52 would challenge the bears’ commitment.

WTI daily chart

WTI additional levels

WTI

Overview
Today last price52.96
Today Daily Change0.46
Today Daily Change %0.88
Today daily open52.48
 
Trends
Daily SMA2051.47
Daily SMA5048.28
Daily SMA10043.96
Daily SMA20040.2
 
Levels
Previous Daily High53.2
Previous Daily Low52.27
Previous Weekly High53.8
Previous Weekly Low51.43
Previous Monthly High49.43
Previous Monthly Low44.01
Daily Fibonacci 38.2%52.63
Daily Fibonacci 61.8%52.85
Daily Pivot Point S152.09
Daily Pivot Point S251.71
Daily Pivot Point S351.16
Daily Pivot Point R153.03
Daily Pivot Point R253.58
Daily Pivot Point R353.96

Author

Dhwani Mehta

Dhwani Mehta

FXStreet

Residing in Mumbai (India), Dhwani is a Senior Analyst and Manager of the Asian session at FXStreet. She has over 10 years of experience in analyzing and covering the global financial markets, with specialization in Forex and commodities markets.

More from Dhwani Mehta
Share:

Editor's Picks

EUR/USD shifts its attention to 1.1900 and above

EUR/USD has shaken off Tuesday’s dip, pushing back beyond the 1.1800 mark amid decent gains as  Wednesday’s session draws to a close. The rebound is largely driven by a modest pullback in the US Dollar, as markets digest the aftermath of President Trump’s SOTU speech and continue to monitor trade-related headlines and signals from the White House.
 

GBP/USD challenges multi-day highs near 1.3530

GBP/USD leaves behind the previous day’s decline and regains fresh upside traction on Wednesday, surpassing the 1.3500 barrier in a context of a modest decline in the Greenback and a generalised improved mood in the risk-linked space. Meanwhile, the US tariff narrative continues to dictate the mood among market participants after Presidet Trump’s SOTU speech failed to surprise markets.

Gold remains bid and close to $5,200

Gold buyers are returning to the fold on Wednesday, targeting the $5,200 area and possibly beyond, after Tuesday’s corrective dip from monthly highs. The rebound in the precious metal comes as the US Dollar loses traction, with Trump’s SOTU speech offering little fresh direction and AI-related nerves continuing to ease.

UK financial watchdog advances stablecoin oversight as four firms pilot issuance

The Financial Conduct Authority (FCA) in the United Kingdom (UK) is advancing toward the final stablecoin regulatory framework with a pilot program involving four companies, including Monee, Financial Technologies ReStabilise, Revolut and VVTX.

Nvidia earnings to influence AI trade and broader market sentiment

For the last three years, Nvidia has been the engine of the AI boom, and now Wall Street is watching to see whether that momentum can keep going. High-growth stocks have been struggling to maintain their bullish trend in 2026.

Cosmos Hub Price Forecast: ATOM rebounds slightly, bearish outlook remains intact

Cosmos Hub (ATOM) price rebounds, trading above $2.05 at the time of writing on Wednesday, after undergoing a sharp correction since last week. Weakening on-chain and derivatives data support a bearish outlook, while technical analysis remains unfavorable.