|

WTI Price Analysis: Eyes further downside below $77.00

  • WTI holds lower grounds near two-week bottom, prints six-day downtrend.
  • Sustained trading below key DMAs, trend line join bearish MACD signal to favor sellers.
  • 10-week-old horizontal support lures bears unless the Oil price remains below 100-DMA.

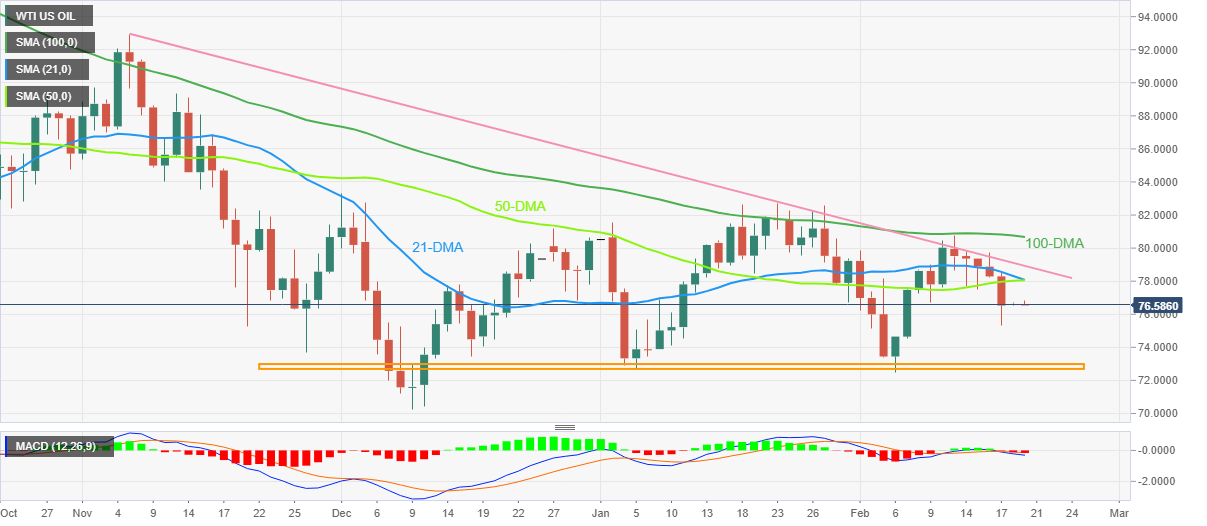
WTI crude oil remains depressed near $76.50 as it fades the late Friday’s bounce off 10-week low during early Monday in Asia. In doing so, the black gold remains below the convergence of the 21-DMA and the 50-DMA, as well as the downward-sloping resistance line from November and the 100-DMA.

Not only the sustained trading below the aforementioned key technical indicators but the bearish MACD signals also keep the WTI sellers hopeful.

That said, the previous day’s bottom surrounding $75.30 lures WTI bears at the latest, a break of which could quickly drag the Oil price towards a horizontal area comprising multiple levels marked since early December, near $73.00-72.70.

In a case where the black gold drops below $72.70, the late 2022 bottom surrounding $70.30 and the $70.00 psychological magnet will be in the spotlight.

Alternatively, recovery moves will initially have to cross the 50-DMA and 21-DMA convergence surrounding $78.10 to convince short-term WTI buyers.

Following that, the aforementioned multi-day-old resistance line near $79.00 and the 100-DMA hurdle surrounding $80.70 could challenge the WTI bulls.

Should the energy benchmark rises past $80.70, January’s high near $82.70 and the last December’s peak of around $83.30 could act as the last defense of the Oil bears.

WTI: Daily chart

Trend: Further downside expected

Additional important levels

Overview
Today last price76.58
Today Daily Change0.05
Today Daily Change %0.07%
Today daily open76.53
 
Trends
Daily SMA2078.4
Daily SMA5077.97
Daily SMA10080.82
Daily SMA20089.44
 
Levels
Previous Daily High78.51
Previous Daily Low75.34
Previous Weekly High80.75
Previous Weekly Low75.34
Previous Monthly High82.68
Previous Monthly Low72.64
Daily Fibonacci 38.2%76.55
Daily Fibonacci 61.8%77.3
Daily Pivot Point S175.08
Daily Pivot Point S273.63
Daily Pivot Point S371.91
Daily Pivot Point R178.24
Daily Pivot Point R279.96
Daily Pivot Point R381.41

Author

Anil Panchal

Anil Panchal

FXStreet

Anil Panchal has nearly 15 years of experience in tracking financial markets. With a keen interest in macroeconomics, Anil aptly tracks global news/updates and stays well-informed about the global financial moves and their implications.

More from Anil Panchal
Share:

Markets move fast. We move first.

Orange Juice Newsletter brings you expert driven insights - not headlines. Every day on your inbox.

By subscribing you agree to our Terms and conditions.

Editor's Picks

EUR/USD bounces toward 1.1750 as US Dollar loses strength

EUR/USD returned to the 1.1750 price zone in the American session on Friday, despite falling Wall Street, which indicates risk aversion. Trading conditions remain thin following the New Year holiday and ahead of the weekend, with the focus shifting to US employment and European data scheduled for next week.

GBP/USD nears 1.3500, holds within familiar levels

After testing 1.3400 on the last day of 2025, GBP/USD managed to stage a rebound. Nevertheless, the pair finds it difficult to gather momentum and trades with modest intraday gains at around 1.3490 as market participants remain in holiday mood.

Gold trims intraday gains, approaches $4,300

Gold retreated sharply from the $4,400  area and trades flat for the day in the $4,320 price zone. Choppy trading conditions exacerbated the intraday decline, although XAU/USD bearish case is out of the picture, considering growing expectations for a dovish Fed and persistent geopolitical tensions.

Cardano gains early New Year momentum, bulls target falling wedge breakout

Cardano kicks off the New Year on a positive note and is extending gains, trading above $0.36 at the time of writing on Friday. Improving on-chain and derivatives data point to growing bullish interest, while the technical outlook keeps an upside breakout in focus.

Economic outlook 2026-2027 in advanced countries: Solidity test

After a year marked by global economic resilience and ending on a note of optimism, 2026 looks promising and could be a year of solid economic performance. In our baseline scenario, we expect most of the supportive factors at work in 2025 to continue to play a role in 2026.

Crypto market outlook for 2026

Year 2025 was volatile, as crypto often is.  Among positive catalysts were favourable regulatory changes in the U.S., rise of Digital Asset Treasuries (DAT), adoption of AI and tokenization of Real-World-Assets (RWA).