WTI Price Analysis: Dribbles below $110.00 even as bulls eye monthly resistance
- WTI grinds higher during the four-day uptrend, approaches short-term key hurdle.
- RSI conditions suggest difficulties for buyers in crossing the resistance line.
- 61.8% Fibonacci retracement level, weekly support line restrict short-term downside.

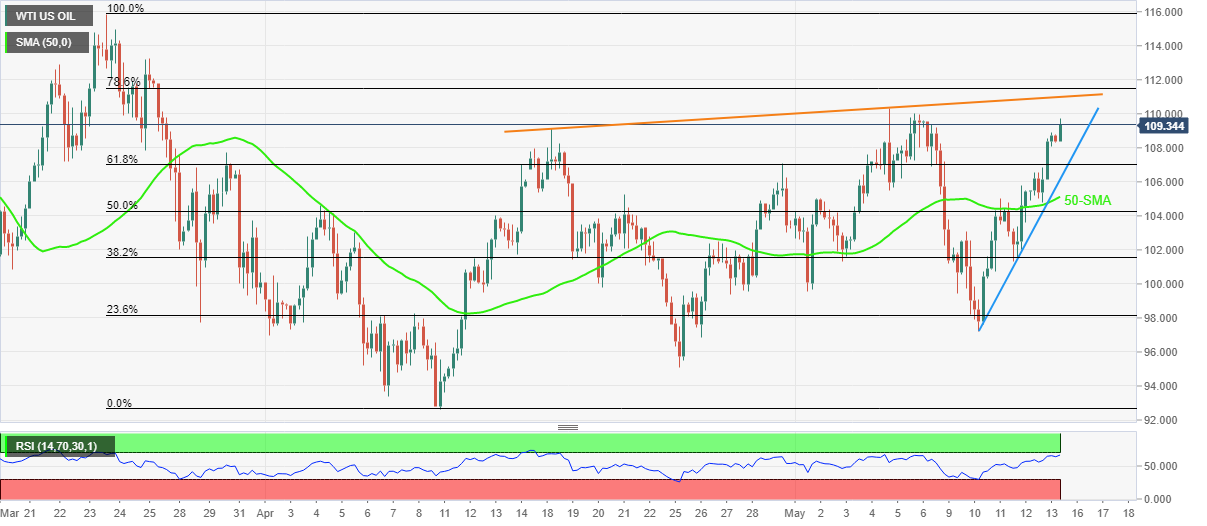
WTI crude oil prices keep the previous week’s recovery moves, despite being sidelined at around $109.50 during Monday’s Asian.
In doing so, the black gold stays above a one-week-old ascending support line, as well as the 50-SMA. The same joins firmer RSI conditions, not overbought, to keep buyers hopeful.
However, an upward sloping trend line from April 18, around $111.00 by the press time, joins the RSI lines rush towards overbought territory to test the energy prices.
Should the quote rises past $111.00, the 78.6% Fibonacci retracement (Fibo.) of the March-April downturn, near $111.60, could act as an additional upside filter before directing the WTI bulls towards late March’s swing high of $115.85.
On the contrary, pullback moves may remain elusive until staying beyond the 61.8% Fibo close to $107.00, quickly followed by the aforementioned support line surrounding $106.10.
Even if the quote drops below $106.10, the 50-SMA level of $105.15 will test WTI sellers before directing them to the $100.00 psychological magnet.
WTI: Four-hour chart
Trend: Limited upside expected
Author

Anil Panchal
FXStreet
Anil Panchal has nearly 15 years of experience in tracking financial markets. With a keen interest in macroeconomics, Anil aptly tracks global news/updates and stays well-informed about the global financial moves and their implications.


