|

WTI Price Analysis: Descending triangle breakout on 1H calls for additional upside

  • WTI looks to extend gains above the $42 mark. 
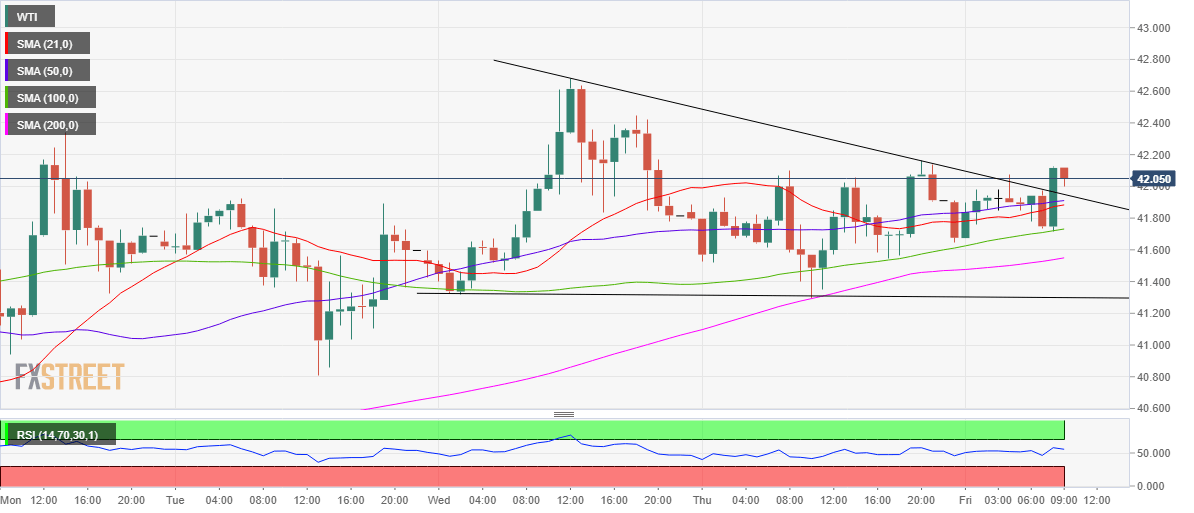
  • Descending triangle breakout confirmed on the hourly chart.
  • 100-HMA at $41.73 offers powerful support.

WTI (futures on NYMEX) is back on the bids above the $42 mark, heading towards multi-day highs of $42.68 despite the risk-off market mood.

Concerns surrounding the covid growth worldwide and Fed-Treasury clash weigh on the investors’ sentiment.

From a technical perspective, the black gold has confirmed a descending triangle breakout on the hourly chart after closing the last hour above the falling trendline resistance at $41.96.

The next target for the bulls awaits at Wednesday’s high of $42.68, above which the $43 threshold will get tested.

The hourly Relative Strength Index (RSI) has turned south but remains well within the bullish region, currently at 55.06, allowing for more gains.

However, if the sellers fight back control, the US oil could drop back towards strong support near 41.95/90 region, where the falling trendline resistance now support coincides with the 50-hourly moving average (HMA).

The next critical cap is seen at the 100-HMA at $41.73. WTI has not given an hourly closing below that level since late Tuesday.

A breach of the last could bring the 200-HMA support back in play, which is at $41.55. Meanwhile, the pattern support is located at $41.30.

WTI hourly chart

WTI additional levels

WTI

Overview
Today last price42.11
Today Daily Change-0.01
Today Daily Change %-0.02
Today daily open42.07
 
Trends
Daily SMA2039.53
Daily SMA5039.82
Daily SMA10040.61
Daily SMA20037.06
 
Levels
Previous Daily High42.16
Previous Daily Low41.3
Previous Weekly High43.28
Previous Weekly Low37.43
Previous Monthly High41.93
Previous Monthly Low35.08
Daily Fibonacci 38.2%41.83
Daily Fibonacci 61.8%41.63
Daily Pivot Point S141.52
Daily Pivot Point S240.98
Daily Pivot Point S340.66
Daily Pivot Point R142.39
Daily Pivot Point R242.71
Daily Pivot Point R343.26

Author

Dhwani Mehta

Dhwani Mehta

FXStreet

Residing in Mumbai (India), Dhwani is a Senior Analyst and Manager of the Asian session at FXStreet. She has over 10 years of experience in analyzing and covering the global financial markets, with specialization in Forex and commodities markets.

More from Dhwani Mehta
Share:

Markets move fast. We move first.

Orange Juice Newsletter brings you expert driven insights - not headlines. Every day on your inbox.

By subscribing you agree to our Terms and conditions.

Editor's Picks

EUR/USD stays defensive below 1.1750 as USD finds its feet

EUR/USD kicks off the new week on a softer note, holding below 1.1750 in European trading on Monday. The pair faces challenges due to a pause in the US Dollar downtrend, with traders shifting their focus to the delayed US Nonfarm Payrolls and CPI data for fresh directives. The ECB policy decision is also eagerly awaited. 

GBP/USD holds steady above 1.3350 as traders await key data and BoE

GBP/USD remains on the back foot above 1.3350 in the European session on Monday, though it lacks bearish conviction and holds above the key 200-day SMA support. The US Dollar holds its recovery mode ahead of key data releases, while the Pound Sterling faces headwinds from the expected BoE rate cut this week. 

Gold climbs to seven-week highs on Fed rate cut bets, safe-haven demand

Gold price rises to seven-week highs to near $4,350 during the early European trading hours on Monday. The precious metal extends its upside amid the prospect of interest rate cuts by the US Fed next year. Lower interest rates could reduce the opportunity cost of holding Gold, supporting the non-yielding precious metal.

Solana consolidates as spot ETF inflows near $1 billion signal institutional dip-buying

Solana price hovers above $131 at the time of writing on Monday, nearing the upper boundary of a falling wedge pattern, awaiting a decisive breakout. On the institutional side, demand for spot Solana Exchange-Traded Funds remained firm, pushing total assets under management to nearly $1 billion since launch. 

Big week ends with big doubts

The S&P 500 continued to push higher yesterday as the US 2-year yield wavered around the 3.50% mark following a Federal Reserve (Fed) rate cut earlier this week that was ultimately perceived as not that hawkish after all. The cut is especially boosting the non-tech pockets of the market.

Solana Price Forecast: SOL consolidates as spot ETF inflows near $1 billion signal institutional dip-buying

Solana (SOL) price hovers above $131 at the time of writing on Monday, nearing the upper boundary of a falling wedge pattern, awaiting a decisive breakout.