|

WTI Price Analysis: Crude drops below $60 after head-and-shoulders breakdown

  • WTI drops below $60 to hit the lowest since Feb. 22. 
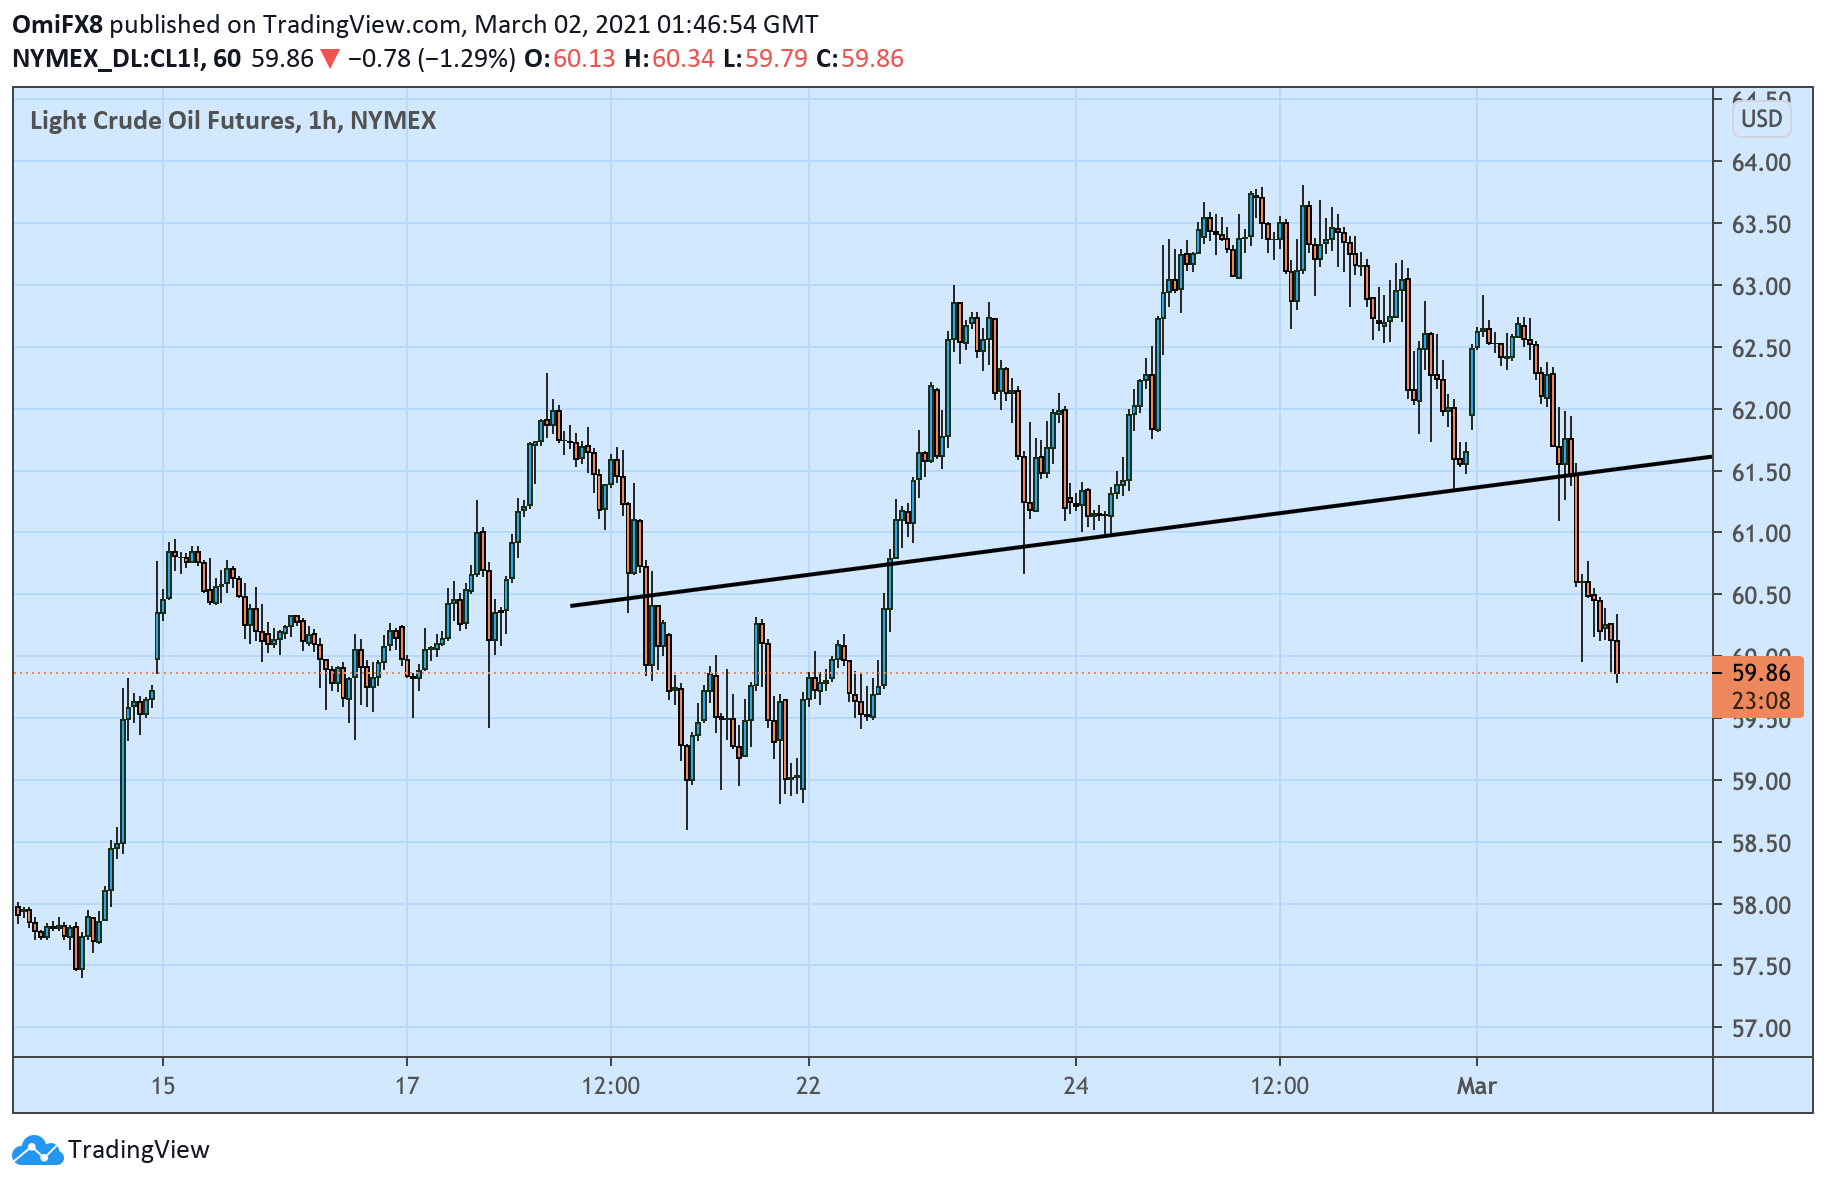
  • The hourly chart shows scope for a deeper decline. 

West Texas Intermediate (WTI) crude, a North American oil benchmark, printed a low of $59.86 soon before press time, having confirmed a head-and-shoulders (H&S) breakdown, a bearish reversal pattern, on the hourly chart on Monday. 

Oil could drop further, as the H&S breakdown has opened the doors for $59.13 (target as per the measured move method). 

The case for a deeper pullback looks strong, with the daily chart flashing a bearish Doji reversal pattern. Further, the 14-day Relative Strength Index (RSI) is diving out of a sideways channel in favor of the bears. 

Acceptance above the 200-hour Simple Moving Average at $61.55 would invalidate the bearish view. 

Hourly chart

Trend: Bearish

Technical levels

WTI

Overview
Today last price59.68
Today Daily Change-0.68
Today Daily Change %-1.13
Today daily open60.36
 
Trends
Daily SMA2059.4
Daily SMA5054.3
Daily SMA10048.46
Daily SMA20044.24
 
Levels
Previous Daily High62.82
Previous Daily Low59.89
Previous Weekly High63.72
Previous Weekly Low58.81
Previous Monthly High63.72
Previous Monthly Low51.6
Daily Fibonacci 38.2%61.01
Daily Fibonacci 61.8%61.7
Daily Pivot Point S159.23
Daily Pivot Point S258.09
Daily Pivot Point S356.3
Daily Pivot Point R162.16
Daily Pivot Point R263.95
Daily Pivot Point R365.09

Author

Omkar Godbole

Omkar Godbole

FXStreet Contributor

Omkar Godbole, editor and analyst, joined FXStreet after four years as a research analyst at several Indian brokerage companies.

More from Omkar Godbole
Share:

Markets move fast. We move first.

Orange Juice Newsletter brings you expert driven insights - not headlines. Every day on your inbox.

By subscribing you agree to our Terms and conditions.

Editor's Picks

EUR/USD clings to small gains near 1.1750

Following a short-lasting correction in the early European session, EUR/USD regains its traction and clings to moderate gains at around 1.1750 on Monday. Nevertheless, the pair's volatility remains low, with investors awaiting this weeks key data releases from the US and the ECB policy announcements.

GBP/USD remains confined in a range above mid-1.3300s ahead of UK jobs report

The GBP/USD pair extends its sideways consolidative price move through the Asian session on Tuesday and currently trades around the 1.3370-1.3365 region, nearly unchanged for the day. Traders seem reluctant and opt to wait for this week's important macro releases and the key central bank event risk before placing fresh directional bets.

Gold defends $4,300 as focus shifts to US NFP, PMI data

Gold price holds the $4,300 level, easing from the highest since October 21 in the Asian trading hours on Tuesday. The precious metal stays afloat on further US Federal Reserve rate cut bets. The US Nonfarm Payrolls report will take center stage later on Tuesday. Also, the US Retail Sales and Purchasing Managers Index will be published. 

Top Crypto Losers: Aster, Midnight, and Ethena extend losses as selling pressure mounts

Aster, Midnight, and Ethena are the altcoins with the most losses over the last 24 hours, as the broader cryptocurrency market weakens amid Bitcoin dropping below $86,000.

NFP preview: Complex data release will determine if Fed was right to cut rates

The long wait is over, and the Bureau of Labor Statistics in the US will release nonfarm payrolls reports for both November and October at 1330 GMT on Tuesday. The overall NFP figure for October is expected to be -10k, however, it is expected to be influenced by a massive 130k drop in federal department workers. 

Solana Price Forecast: SOL consolidates as spot ETF inflows near $1 billion signal institutional dip-buying

Solana (SOL) price hovers above $131 at the time of writing on Monday, nearing the upper boundary of a falling wedge pattern, awaiting a decisive breakout.