WTI Price Analysis: Bulls jostle with 50-EMA, three-week-old resistance line
- WTI crude oil bulls struggle to defend the latest two-day uptrend.
- Short-term key EMA, descending trend line challenge further upside amid retreat in MACD signals.
- Six-week-old horizontal area holds the key to buyer’s conviction.

WTI crude oil fades upside momentum as it prints mild gains around $78.70 during early Wednesday. In doing so, the black gold seesaws around a convergence of the 50-Exponential Moving Average (EMA) and a downward-sloping trend line from November 07.
In addition to the key EMA and resistance line, the receding bullish bias of the Moving Average Convergence and Divergence (MACD) indicator also keeps the WTI sellers hopeful.
That said, pullback moves may aim for $77.00 as immediate support before challenging the recently flashed yearly low surrounding $73.65.
In a case where the energy benchmark stays bearish past $73.65, the odds of witnessing a south-run towards the $70.00 psychological magnet can’t be ruled out before highlighting the late 2021 low near $62.35 for sellers.
On the flip side, recovery moves may initially confront the aforementioned trend line near $79.10 before attacking the 50-EMA level near $79.25. Also acting as a nearby upside hurdle is the latest swing high near $79.70.
Above all, a broad resistance area comprising levels marked since October 18, between $81.30 and $82.30, appears the key hurdle for the WTI bulls.
WTI: Four-hour chart
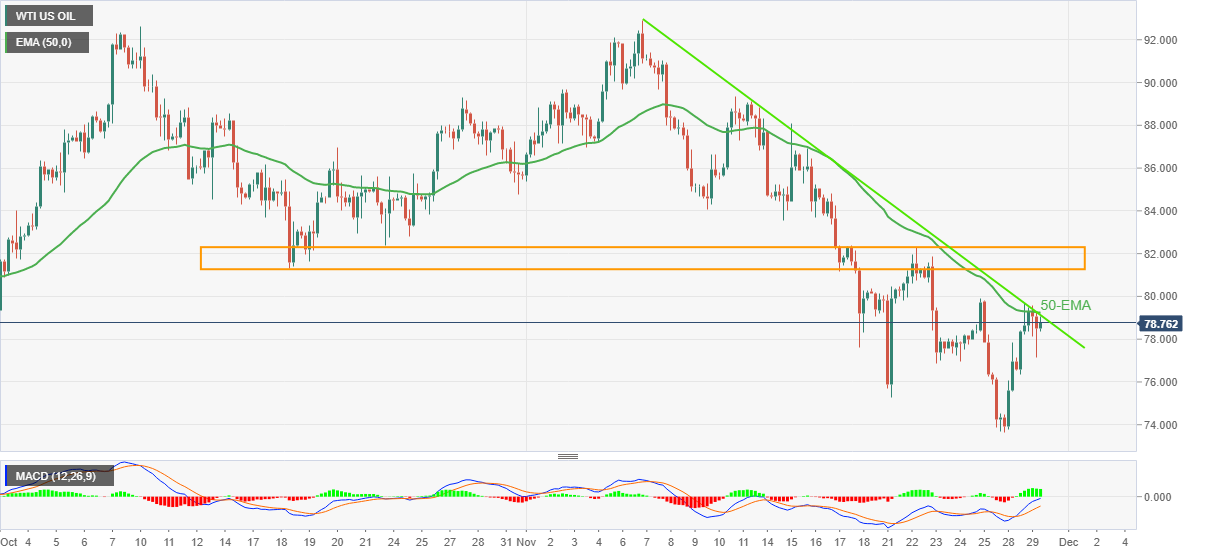
Trend: Pullback expected
Author

Anil Panchal
FXStreet
Anil Panchal has nearly 15 years of experience in tracking financial markets. With a keen interest in macroeconomics, Anil aptly tracks global news/updates and stays well-informed about the global financial moves and their implications.


