WTI Price Analysis: Bullish H&S in the making on daily chart
- WTI bulls looking to engage in anticipation of a bullish continuation.
- Daily inverse H&S is a compelling feature on the charts.

West Texas Intermediate, WTI, crude oil ended higher on Wednesday as a report showed an unexpected drop in US inventories while China's imports rose last month. Nevertheless, the bulls remain in good stead as per the following technical analysis:
WTI daily chart
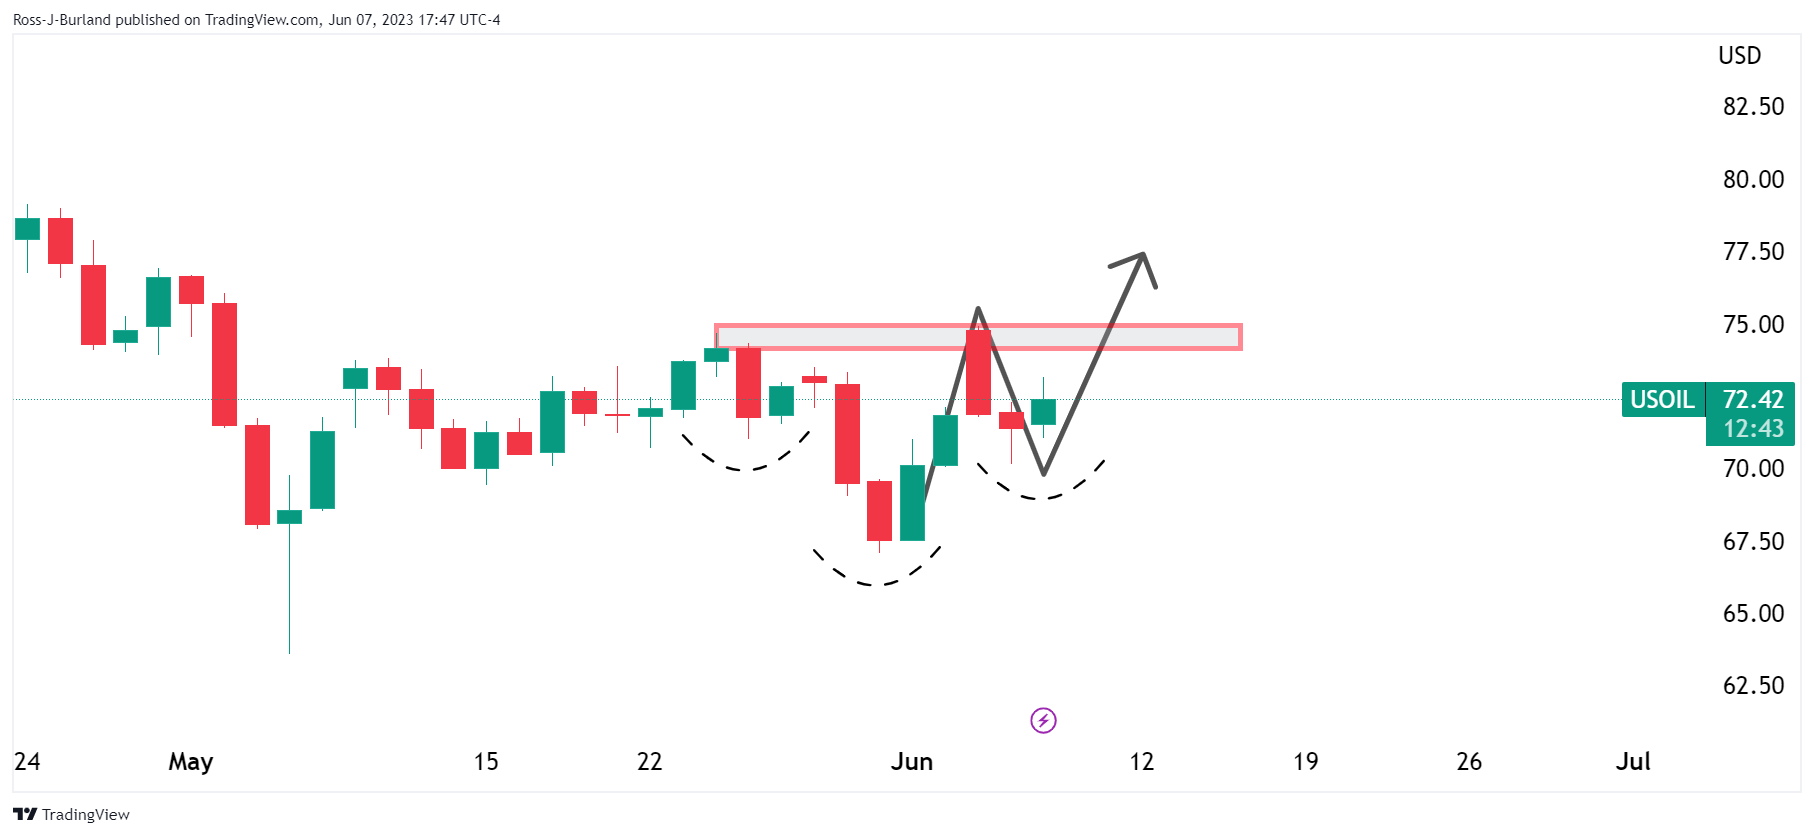
We have an inverse head and shoulders which is bullish.
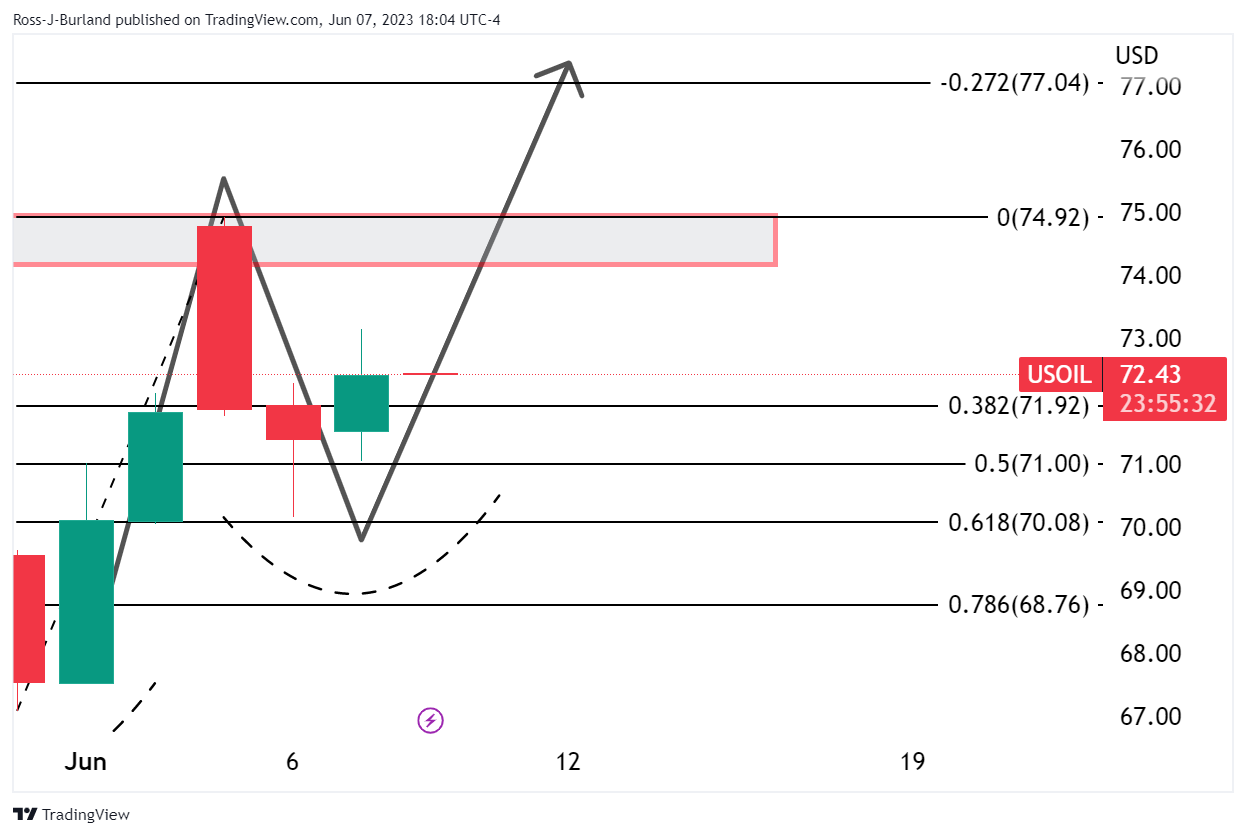
Pulling the chart across to see the impulse correction and what could now be another bullish impulse in the making, we can see that the market is supported at a 61.8% Fibonacci retracement level. This too is bullish.
WTI H4 chart
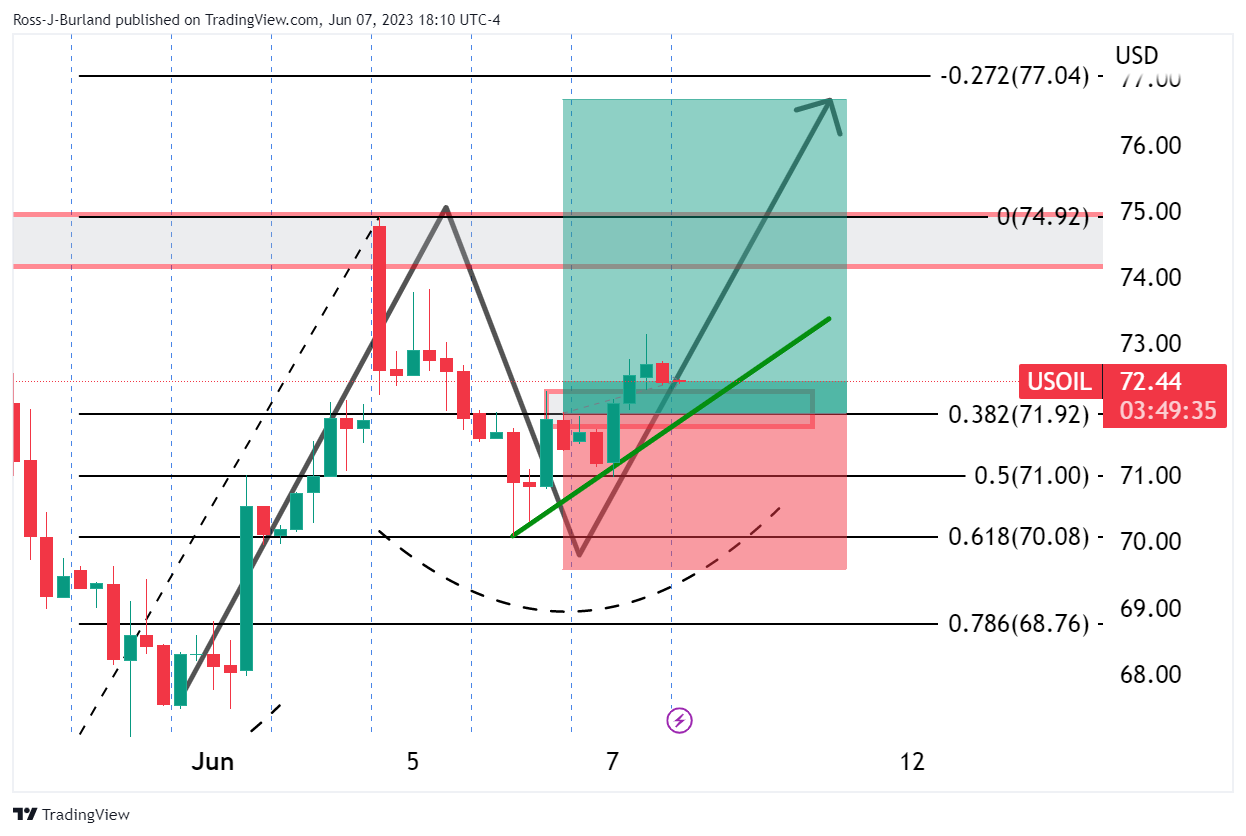
The 4-hour chart shows the price has breached prior resistance that could now well act as a support on the pullback. Bulls could be encouraged to enter the market in anticipation of a bullish continuation.
Author

Ross J Burland
FXStreet
Ross J Burland, born in England, UK, is a sportsman at heart. He played Rugby and Judo for his county, Kent and the South East of England Rugby team.


