|

WTI Price Analysis: 50-day SMA guards immediate upside

  • WTI stays above 50% Fibonacci retracement following its bounce off 200-day SMA.
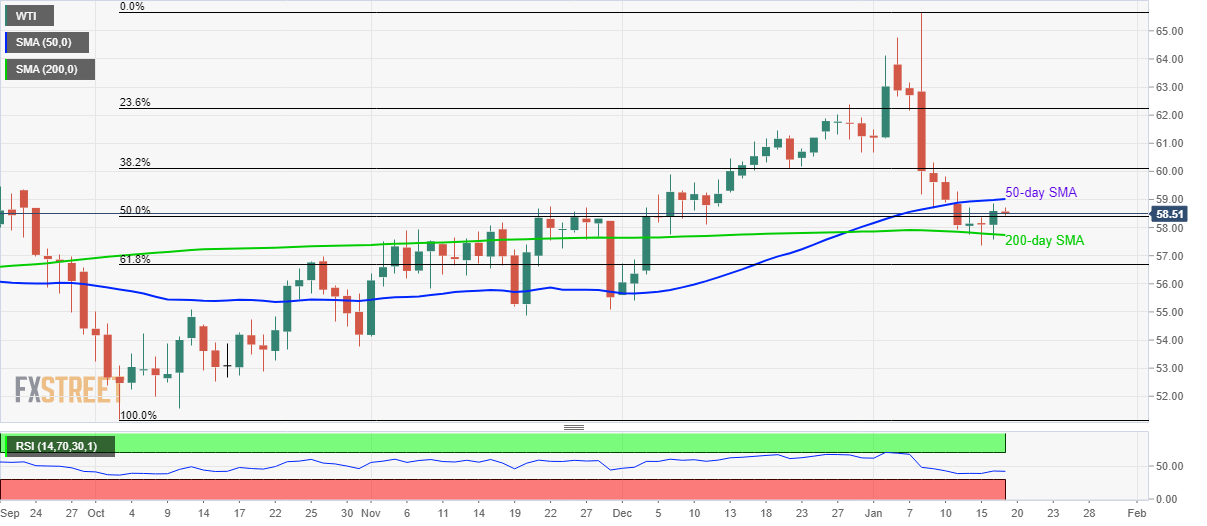
  • 61.8% and 38.2% Fibonacci retracements could entertain traders during either side break of the short-term key levels.

WTI trades around $58.50 during the early Friday. In doing so, the oil benchmark fails to cross 50-day SMA despite taking a U-turn from 200-day SMA, also trading successfully beyond 50% Fibonacci retracement of the October-January upside.

Hence, traders will keep eyes on the black gold’s momentum either during its rise beyond a 50-day SMA level of $59.00 or on the downside break of 200-day SMA surrounding $57.70.

The 61.8% and 38.2% Fibonacci retracements, around $56.65 and $60.10 will be on the traders’ radar during the breaks.

If at all prices manage to remain strong beyond $60.10, the return of $62.50 can’t be denied.

On the flip side, oil price declines below $56.65 can fetch the quote to November 2019 bottom surrounding $54.90.

WTI daily chart

Trend: Sideways

Additional important levels

Overview
Today last price58.51
Today Daily Change-0.08
Today Daily Change %-0.14%
Today daily open58.59
 
Trends
Daily SMA2060.61
Daily SMA5058.98
Daily SMA10057.25
Daily SMA20057.76
 
Levels
Previous Daily High58.87
Previous Daily Low57.57
Previous Weekly High65.67
Previous Weekly Low58.69
Previous Monthly High62.38
Previous Monthly Low55.41
Daily Fibonacci 38.2%58.37
Daily Fibonacci 61.8%58.07
Daily Pivot Point S157.82
Daily Pivot Point S257.04
Daily Pivot Point S356.52
Daily Pivot Point R159.12
Daily Pivot Point R259.64
Daily Pivot Point R360.42

Author

Anil Panchal

Anil Panchal

FXStreet

Anil Panchal has nearly 15 years of experience in tracking financial markets. With a keen interest in macroeconomics, Anil aptly tracks global news/updates and stays well-informed about the global financial moves and their implications.

More from Anil Panchal
Share:

Editor's Picks

EUR/USD meets initial support around 1.1800

EUR/USD remains on the back foot, although it has managed to reverse the initial strong pullback toward the 1.1800 region and regain some balance, hovering around the 1.1850 zone as the NA session draws to a close on Tuesday. Moving forward, market participants will now shift their attention to the release of the FOMC Minutes and US hard data on Wednesday.
 

GBP/USD bounces off lows, retargets 1.3550

After bottoming out just below the 1.3500 yardstick, GBP/USD now gathers some fresh bids and advances to the 1.3530-1.3540 band in the latter part of Tuesday’s session. Cable’s recovery comes as the Greenback surrenders part of its advance, although it keeps the bullish bias well in place for the day.

Gold remains offered below $5,000

Gold stays on the defensive on Tuesday, receding to the sub-$5,000 region per troy ounce on the back of the persistent move higher in the Greenback. The precious metal’s decline is also underpinned by the modest uptick in US Treasury yields across the spectrum.

Ethereum Price Forecast: BitMine extends ETH buying streak, says long-term outlook remains positive

Ethereum (ETH) treasury firm BitMine Immersion continued its weekly purchase of the top altcoin last week after acquiring 45,759 ETH.

UK jobs market weakens, bolstering rate cut hopes

In the UK, the latest jobs report made for difficult reading. Nonetheless, this represents yet another reminder for the Bank of England that they need to act swiftly given the collapse in inflation expected over the coming months. 

Ripple slides to $1.45 as downside risks surge

Ripple edges lower at the time of writing on Tuesday, from the daily open of $1.48, as headwinds persist across the crypto market. A short-term support is emerging at $1.45, but a buildup of bearish positions could further weaken the derivatives market and prolong the correction.